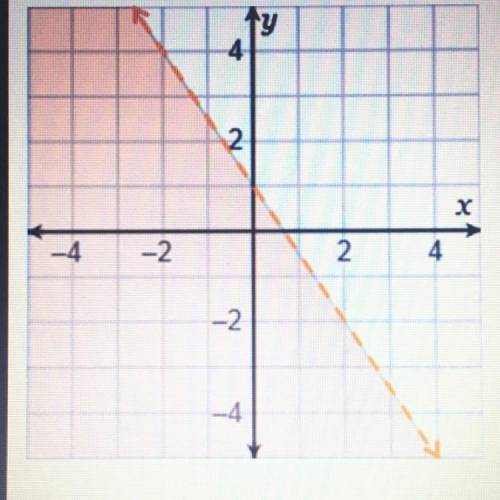
Which inequality is represented by the graph?
A. y > -2/3x+1
B. y < -2/3x +1
C. y...

Mathematics, 20.10.2020 02:01 cdyshaylia55
Which inequality is represented by the graph?
A. y > -2/3x+1
B. y < -2/3x +1
C. y < -3/2x +1
D. y> -3/2x +1
PLEASE HELP :)

Answers: 1


Another question on Mathematics
Mathematics, 21.06.2019 22:10
Atype of plant is introduced into an ecosystem and quickly begins to take over. a scientist counts the number of plants after mmonths and develops the equation p(m)= 19.3(1.089)^m to model the situation. most recently, the scientist counted 138 plants.assuming there are no limiting factors to the growth of the plants, about how many months have passed since the plants werefirst introduced? a)o 6.1b)0.6.6c)10 72d)o 23.1
Answers: 3
Mathematics, 21.06.2019 23:30
In a study of the relationship between socio-economic class and unethical behavior, 129 university of california undergraduates at berkeley were asked to identify themselves as having low or high social-class by comparing themselves to others with the most (least) money, most (least) education, and most (least) respected jobs. they were also presented with a jar of individually wrapped candies and informed that the candies were for children in a nearby laboratory, but that they could take some if they wanted. after completing some unrelated tasks, participants reported the number of candies they had taken. it was found that those who were identiď¬ed as upper-class took more candy than others. in this study, identify: (a) the cases, (b) the variables and their types, (c) the main research question, (d) identify the population of interest and the sample in this study, and (e) comment on whether or not the results of the study can be generalized to the population, and if the ď¬ndings of the study can be used to establish causal relationships.
Answers: 2
Mathematics, 22.06.2019 02:00
The equation y= -16t^2+120 can be used to represent the fridge height above the ground where ti represents time in seconds after she threw the apple how long does it take the apple to hit the ground running your
Answers: 3
You know the right answer?
Questions
Mathematics, 13.09.2019 08:10
Mathematics, 13.09.2019 08:10
Mathematics, 13.09.2019 08:10

Mathematics, 13.09.2019 08:10

Mathematics, 13.09.2019 08:10

Advanced Placement (AP), 13.09.2019 08:10

English, 13.09.2019 08:10

Chemistry, 13.09.2019 08:10
Mathematics, 13.09.2019 08:10


