
Mathematics, 20.10.2020 03:01 KKHeffner02
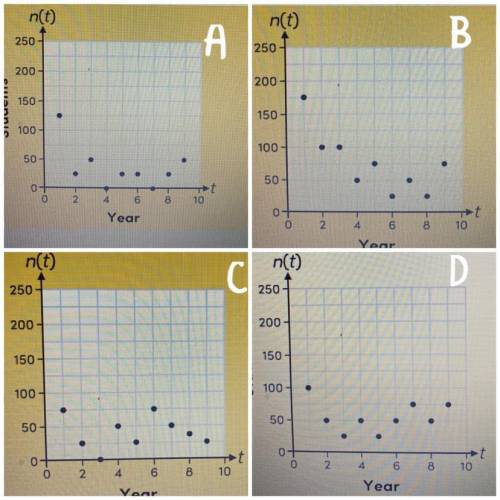
A teacher keeps track of the number of students that participate at least three times in an optional study session each year. He models the attendance over the last nine years with this function.
n(t) = 3.53t^2 - 33.04t + 117.56
Which graph would most likely be associated with the given model?

Answers: 3


Another question on Mathematics
Mathematics, 21.06.2019 16:00
Find the required measurements of the following trapezoids. a = 8 cm b = 16 cm h = 10 cm
Answers: 2
Mathematics, 21.06.2019 18:30
You receive 15% of the profit from a car wash how much money do you receive from a profit of 300
Answers: 2
Mathematics, 21.06.2019 20:30
The cost for an uberi is $2.50 plus $2.00 mile. if the total for the uber ride was $32.50, how many miles did the customer travel?
Answers: 3
Mathematics, 21.06.2019 20:30
Asmall business produces and sells balls. the fixed costs are $20 and each ball costs $4.32 to produce. each ball sells for $8.32. write the equations for the total cost, c, and the revenue, r, then use the graphing method to determine how many balls must be sold to break even.
Answers: 1
You know the right answer?
A teacher keeps track of the number of students that participate at least three times in an optional...
Questions


Health, 28.08.2019 09:30
History, 28.08.2019 09:30
Mathematics, 28.08.2019 09:30
English, 28.08.2019 09:30
English, 28.08.2019 09:30

Chemistry, 28.08.2019 09:30
Mathematics, 28.08.2019 09:30


