
Mathematics, 20.10.2020 04:01 cstevenson
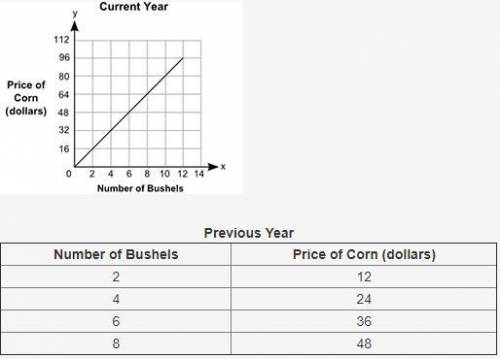
The graph shows the prices of different numbers of bushels of corn at a store in the current year. The table shows the prices of different numbers of bushels of corn at the same store in the previous year. A graph shows Number of Bushels on x-axis and Price of Corn in dollars on y-axis. The x-axis scale is shown from 0 to 14 at increments of 2, and the y-axis scale is shown from 0 to 112 at increments of 16. A straight line joins the ordered pairs 2, 16 and 4, 32 and 6, 48 and 8, 64 and 10, 80 and 12, 96. Previous Year Number of Bushels Price of Corn (dollars) 2 12 4 24 6 36 8 48 Part A: Describe in words how you can find the rate of change of a bushel of corn in the current year, and find the value. (5 points) Part B: How many dollars more is the price of a bushel of corn in the current year than the price of a bushel of corn in the previous year? Show your work. (5 points)

Answers: 3


Another question on Mathematics
Mathematics, 21.06.2019 23:30
At your job you're paid $50 per week plus $3 per sale at least how many saled do you need to make in order to have over $250
Answers: 1
Mathematics, 22.06.2019 02:00
Pls what is the relative minimum of the function? enter your answer in the box
Answers: 3
You know the right answer?
The graph shows the prices of different numbers of bushels of corn at a store in the current year. T...
Questions


Mathematics, 07.11.2020 14:00


History, 07.11.2020 14:00
Mathematics, 07.11.2020 14:00


Social Studies, 07.11.2020 14:00

Mathematics, 07.11.2020 14:00

Computers and Technology, 07.11.2020 14:00

Mathematics, 07.11.2020 14:00
Mathematics, 07.11.2020 14:00


