
Mathematics, 20.10.2020 04:01 rachis
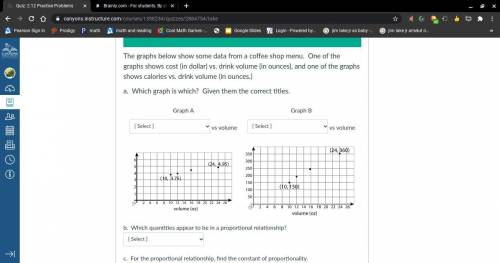
The graphs below show some data from a coffee shop menu. One of the graphs shows cost (in dollar) vs. drink volume (in ounces), and one of the graphs shows calories vs. drink volume (in ounces.)
a. Which graph is which? Given them the correct titles.
Graph A: _vs volume. Graph B:_vs volume
b. Which quantities appear to be in a proportional relationship?
1. cost vs volume or
2. calories vs volume
For the proportional relationship, find the constant of proportionality.
a. 0.21 per ounce,
b. 12 calories per ounce,
c. 0.38$ per ounce, or
d. 15 calories per ounce

Answers: 3


Another question on Mathematics
Mathematics, 21.06.2019 18:00
On a piece of paper, graph y< x+1. then determine which answer matches the graph you drew.
Answers: 2
Mathematics, 21.06.2019 21:30
He ! a group of farmers planned to clean 80 acres of wheat per day to finish the work on schedule. right before the work started, they received a new piece of machinery that them clean 10 more acres per day than originally planned. as a result of increased productivity in the last day before the deadline they only had to clean 30 acres. how many acres of wheat did the group of farmers have to clean?
Answers: 1
Mathematics, 21.06.2019 23:30
In the diagram, ab is tangent to c, ab = 4 inches, and ad = 2 inches. find the radius of the circle.
Answers: 2
You know the right answer?
The graphs below show some data from a coffee shop menu. One of the graphs shows cost (in dollar) vs...
Questions
Mathematics, 15.09.2021 18:30
Mathematics, 15.09.2021 18:30
Mathematics, 15.09.2021 18:30


Biology, 15.09.2021 18:30

Chemistry, 15.09.2021 18:30


Spanish, 15.09.2021 18:30
Social Studies, 15.09.2021 18:30
Mathematics, 15.09.2021 18:30
Mathematics, 15.09.2021 18:30


