
Mathematics, 20.10.2020 09:01 gabrielaperezcz
I. Collect data from several fast food chains on the number of fat calories and grams of saturated fat in menu items. Record at least 12 ordered pairs of (fat calories, grams of saturated fat). Organize your data in a table.
II. Make a scatter plot of the data on graph paper. Be sure to label the axes and use an appropriate title for the graph.
You may wish to use a graphing calculator, spread sheet, or other technology resource (such as the graphing utility link below) to aid you in graphing.
Create a Graph
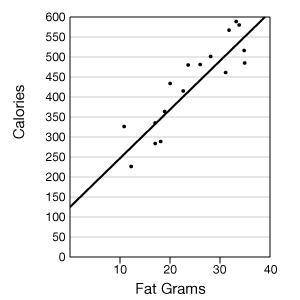
III. Draw a trend line for the scatter plot. Use the following scatter plot of the ordered pairs (fat grams, total calories) as an example.
IV. Calculate the slope of the trend line. (Choose two points on the line and find vertical change over horizontal change.)
Note: Graphing calculators and spread sheets have features with which to draw trend lines and determine the equation. You may choose to use one of these options. If you use technology, indicate what steps were taken to arrive at your equation.
V. Using the slope and y-intercept, write the equation of the trend line ( y = mx + b).
VI. Choose a "calories from fat" value that is not in your collected data set and that is at least 10 fat calories away from any collected value. Use the equation calculated in step V to predict the number of fat grams in an item having that number of fat calories. Be sure to show your work.
VII. Search for an item in a fast food menu having the same number of fat calories as the one you chose above. (If you cannot find the exact value, get as close as you can.) Compare the calculated value from step VI to this actual value. Explain why (or why not) you would have expected your prediction (calculated value) to be close to the actual value.

Answers: 3


Another question on Mathematics
Mathematics, 21.06.2019 15:00
Solve the equation using the given values: x= -2.5; y= -7.51. 2xy + 2x²
Answers: 3
Mathematics, 21.06.2019 17:30
Colby and jaquan are growing bacteria in an experiment in a laboratory. colby starts with 50 bacteria in his culture and the number of bacteria doubles every 2 hours. jaquan starts with 80 of a different type of bacteria that doubles every 3 hours. let x equal number of days. colbys experiment follows the model: a.) y=50*2^x b.) y=50*2^8x c.) y=50*2^12x jaquans experiment follows the model: a.)80*2^x b.)80*2^8x c.)80*2^12x
Answers: 3
Mathematics, 21.06.2019 21:50
What is the 17th term in the arithmetic sequence in which a6 is 101 and a9 is 83
Answers: 1
Mathematics, 21.06.2019 22:10
Aadc is formed by reflecting aabc across line segment ac, as shown in the figure. if the length of ac is 4 units, the area of aadc is square units.
Answers: 3
You know the right answer?
I. Collect data from several fast food chains on the number of fat calories and grams of saturated f...
Questions

Mathematics, 11.05.2021 16:50
Mathematics, 11.05.2021 16:50

Physics, 11.05.2021 16:50

Social Studies, 11.05.2021 16:50

Health, 11.05.2021 16:50

Chemistry, 11.05.2021 16:50

Computers and Technology, 11.05.2021 16:50
Mathematics, 11.05.2021 16:50
History, 11.05.2021 16:50
Mathematics, 11.05.2021 16:50
Mathematics, 11.05.2021 16:50
Mathematics, 11.05.2021 16:50


