
Mathematics, 20.10.2020 20:01 yuvin
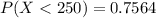
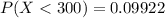
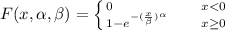
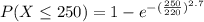
The Weibull distribution is widely used in statistical problems relating to aging of solid insulating materials subjected to aging and stress. Use this distribution as a model for time (in hours) to failure of solid insulating specimens subjected to AC voltage. The values of the parameters depend on the voltage and temperature; suppose α = 2.6 and β = 220. (a) What is the probability that a specimen's lifetime is at most 250? Less than 250? More than 300? (Round your answers to four decimal places.) at most 250 less than 250 more than 300 (b) What is the probability that a specimen's lifetime is between 100 and 250? (Round your answer to four decimal places.) (c) What value is such that exactly 50% of all specimens

Answers: 3
 ,
, 


![P(X x ) = \frac{x}{20} =[ -ln0.50 ] ^{frac{1}{2.7}}](/tpl/images/0824/8424/9fb9a.png)
![x = 220[ -ln0.50 ] ^{frac{1}{2.7}}](/tpl/images/0824/8424/04296.png)


Another question on Mathematics
Mathematics, 21.06.2019 13:00
Find the total area for the regular pyramid ( follow the answer set up in the picture)
Answers: 1
Mathematics, 21.06.2019 16:00
Part one: measurements 1. measure your own height and arm span (from finger-tip to finger-tip) in inches. you will likely need some from a parent, guardian, or sibling to get accurate measurements. record your measurements on the "data record" document. use the "data record" to you complete part two of this project. name relationship to student x height in inches y arm span in inches archie dad 72 72 ginelle mom 65 66 sarah sister 64 65 meleah sister 66 3/4 67 rachel sister 53 1/2 53 emily auntie 66 1/2 66 hannah myself 66 1/2 69 part two: representation of data with plots 1. using graphing software of your choice, create a scatter plot of your data. predict the line of best fit, and sketch it on your graph. part three: the line of best fit include your scatter plot and the answers to the following questions in your word processing document 1. 1. which variable did you plot on the x-axis, and which variable did you plot on the y-axis? explain why you assigned the variables in that way. 2. write the equation of the line of best fit using the slope-intercept formula $y = mx + b$. show all your work, including the points used to determine the slope and how the equation was determined. 3. what does the slope of the line represent within the context of your graph? what does the y-intercept represent? 5. use the line of best fit to you to describe the data correlation.
Answers: 2
Mathematics, 21.06.2019 17:00
The center of a circle represent by the equation (x+9)^2+(y-6)^2=10^2 (-9,6), (-6,9), (6,-9) ,(9,-6)
Answers: 1
Mathematics, 21.06.2019 20:00
Evaluate the discriminant of each equation. tell how many solutions each equation has and whether the solutions are real or imaginary. 4x^2 + 20x + 25 = 0
Answers: 2
You know the right answer?
The Weibull distribution is widely used in statistical problems relating to aging of solid insulatin...
Questions

Mathematics, 11.10.2021 09:50


History, 11.10.2021 09:50
Mathematics, 11.10.2021 09:50

Computers and Technology, 11.10.2021 09:50

English, 11.10.2021 09:50
Mathematics, 11.10.2021 09:50
Mathematics, 11.10.2021 09:50


Mathematics, 11.10.2021 09:50
Chemistry, 11.10.2021 09:50


