
Mathematics, 21.10.2020 01:01 charismameeks
AP Statistics teachers from across the country meet annually in Kansas City to score AP Statistics
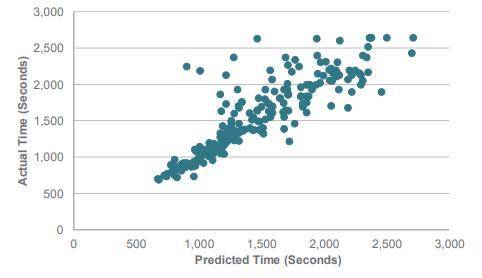
exams. One social event that many teachers participate in is the annual Prediction Fun Run. Prior to the
race, the teachers predict how long it will take them to complete the 1.96-mile long course. During the
event, they are timed and their actual finishing times are paired with their predicted times. Here is a
scatterplot of the results.
The winner of the race is not the fastest runner, but the most accurate runner.
a) Let x = the runner’s predicted time (in seconds) and y = the runner’s actual time (in seconds).
Provide the equation of the line that can be used to assess how accurate the runners were. Plot
this line on the graph above. Clearly label two points you are using to plot the line.
b) Is the line you drew in part (a) a least-squares regression line for these data? Explain.
c) While many runners were quite good at predicting their race time, some runners did very poorly at
this task. Circle the point of the runner who had the largest error in prediction. Justify your choice.
Was this runner faster or slower than predicted?
d) Describe the relationship between predicted time and actual time. Are all runners able to predict
their actual times approximately equally well?

Answers: 3


Another question on Mathematics
Mathematics, 21.06.2019 23:30
What is the explicit rule for the sequence in simplified form? −1,−4,−7,−10,−13… an=4−5n an=−4−3n an=2−3n an=−6−5n
Answers: 1
Mathematics, 22.06.2019 01:30
Given are five observations for two variables, x and y. xi 1 2 3 4 5 yi 3 7 5 11 14 which of the following is a scatter diagrams accurately represents the data? what does the scatter diagram developed in part (a) indicate about the relationship between the two variables? try to approximate the relationship betwen x and y by drawing a straight line through the data. which of the following is a scatter diagrams accurately represents the data? develop the estimated regression equation by computing the values of b 0 and b 1 using equations (14.6) and (14.7) (to 1 decimal). = + x use the estimated regression equation to predict the value of y when x = 4 (to 1 decimal). =
Answers: 3
Mathematics, 22.06.2019 02:00
Consider the linear function that is represented by the equation y= 4x+5
Answers: 1
You know the right answer?
AP Statistics teachers from across the country meet annually in Kansas City to score AP Statistics...
Questions
Mathematics, 20.11.2020 01:00


History, 20.11.2020 01:00
History, 20.11.2020 01:00


Mathematics, 20.11.2020 01:00
Physics, 20.11.2020 01:00

Mathematics, 20.11.2020 01:00
Mathematics, 20.11.2020 01:00
Physics, 20.11.2020 01:00

Social Studies, 20.11.2020 01:00


