Mathematics, 21.10.2020 20:01 marquezbell6577
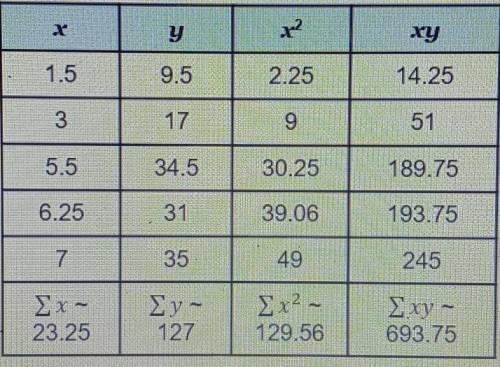
The table shows the relationship between the number of trucks filled with mulch (x) and the number of tons of mulch (y) delivered by a landscaping company. Which regression equation models the data?
A. y = 4.8x + 3
B. y = 3x + 4.8
C. y = x + 20.8
D. y = 20.8x + 1


Answers: 3


Another question on Mathematics

Mathematics, 21.06.2019 16:30
The spring the owner of a sporting good store decreases the price of winter gloves from $10 to $8 each increases the price of swimming goggles from $8 to $10 without doing the math you think the percent decrease in the price of the gloves the same as the percent increase of the goggles explain why or why not
Answers: 1

Mathematics, 21.06.2019 20:30
Arectangle has a width of 5 cm and a length of 10 cm. if the width is increased by 3, how does the perimeter change?
Answers: 1


Mathematics, 22.06.2019 02:30
The john nash mall used 17,4000 kilowatt hours in may, with a peak load of 92 kilowatts. the demand charge is $5.95 per kilowatt, and the energy charge is $0.08 per kilowatt hour. the fuel adjustment charge is $0.017 per kilowatt hour. what is the total electricity cost for may?
Answers: 2
You know the right answer?
The table shows the relationship between the number of trucks filled with mulch (x) and the number o...
Questions


Mathematics, 18.02.2021 22:00

Mathematics, 18.02.2021 22:00

SAT, 18.02.2021 22:00

Mathematics, 18.02.2021 22:00


Mathematics, 18.02.2021 22:00


Chemistry, 18.02.2021 22:00

History, 18.02.2021 22:00

English, 18.02.2021 22:00

Social Studies, 18.02.2021 22:00

Mathematics, 18.02.2021 22:00

Mathematics, 18.02.2021 22:00


English, 18.02.2021 22:00


