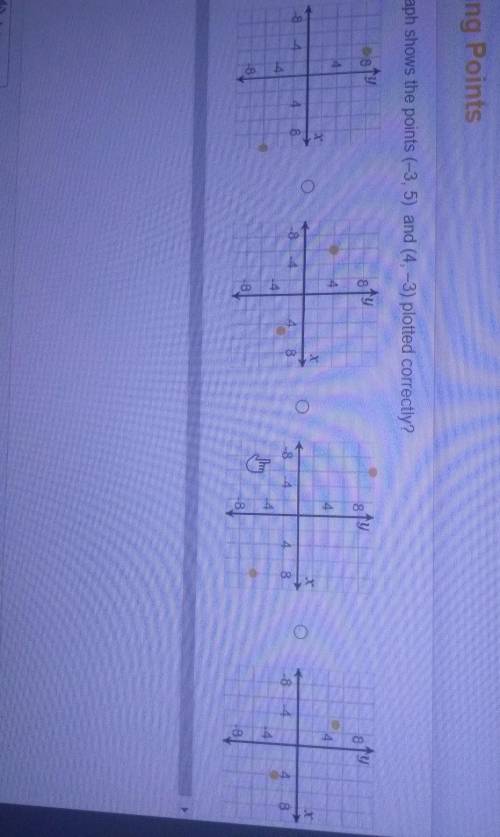
Which shows graph (-3,5) and (4,-3) plotted correctly?
...

Answers: 3


Another question on Mathematics

Mathematics, 21.06.2019 15:50
Which formula finds the probability that a point on the grid below will be in the blue area? p(blue) = total number of squares number of blue squares number of blue squares p(blue) = total number of squares number of blue squares p(blue) = number of white squares
Answers: 1
Mathematics, 21.06.2019 21:50
Desmond wants to sell his car that he paid $8,000 for 2 years ago. the car depreciated, or decreased in value, at a constant rate each month over a 2-year period. if x represents the monthly depreciation amount, which expression shows how much desmond can sell his car for today? \ 8,000 + 24x 8,000 - 24x 8,000 + 2x 8,000 - 2x
Answers: 3
Mathematics, 21.06.2019 22:30
1.based of the diagrams what is the the value of x? 2.how would you verify your answer for x
Answers: 1
You know the right answer?
Questions


Computers and Technology, 16.10.2020 14:01


History, 16.10.2020 14:01


