
Mathematics, 22.10.2020 07:01 brandon1888
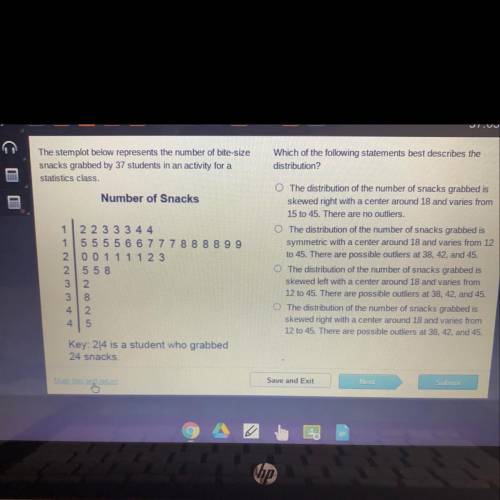
The stemplot below represents the number of bite-size
snacks grabbed by 37 students in an activity for a
statistics class.
Which of the following statements best describes the
distribution?
Number of Snacks
1 2 2 3 3 3 4 4
1 5 5 5 5 6 6 7 7 7 8 8 8 8 9 9
2 0 0 1 1 1 1 2 3
25 5 8
32
3. 8
4 2
4 5
The distribution of the number of snacks grabbed is
skewed right with a center around 18 and varies from
15 to 45. There are no outliers.
The distribution of the number of snacks grabbed is
symmetric with a center around 18 and varies from 12
to 45. There are possible outliers at 38, 42, and 45.
The distribution of the number of snacks grabbed is
skewed left with a center around 18 and varies from
12 to 45. There are possible outliers at 38, 42, and 45.
The distribution of the number of snacks grabbed is
skewed right with a center around 18 and varies from
12 to 45. There are possible outliers at 38, 42, and 45.
Key: 24 is a student who grabbed
24 snacks.

Answers: 1


Another question on Mathematics
Mathematics, 21.06.2019 22:30
Solve: 25 points find the fifth term of an increasing geometric progression if the first term is equal to 7−3 √5 and each term (starting with the second) is equal to the difference of the term following it and the term preceding it.
Answers: 1
Mathematics, 21.06.2019 23:40
Which is the scale factor proportion for the enlargement shown?
Answers: 1
Mathematics, 22.06.2019 01:30
What is the solution to the system of equations? y=1.5-3 y=-x
Answers: 2
You know the right answer?
The stemplot below represents the number of bite-size
snacks grabbed by 37 students in an activity...
Questions
Mathematics, 14.06.2021 05:30

Geography, 14.06.2021 05:30


Mathematics, 14.06.2021 05:30

Geography, 14.06.2021 05:30
Mathematics, 14.06.2021 05:30
Mathematics, 14.06.2021 05:30
Social Studies, 14.06.2021 05:30

Health, 14.06.2021 05:30


