
Mathematics, 22.10.2020 21:01 sabrikat
Please help me, I really dont want to get an F :((( (The Graph Is In The Image)
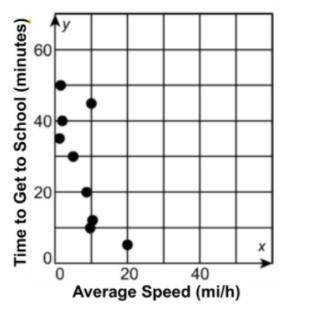
The graph shows the data for the time it takes Jerome to bike to school, based on his average biking speed for that trip. Which sentence describes the association?
A. The speed he bikes at affects the time it take him to get to school, but it is unclear if the time increases or decreases.
B. As the average speed increases, the time he takes to get to school decreases.
C. The speed he bikes at does not affect the time it takes him to get to school.
D. As the average speed increases, so does the time he takes to get to school.

Answers: 1


Another question on Mathematics
Mathematics, 21.06.2019 19:30
Find the coordinates of point x that lies along the directed line segment from y(-8, 8) to t(-15, -13) and partitions the segment in the ratio of 5: 2.
Answers: 1
Mathematics, 21.06.2019 23:30
Darren earned $663.26 in net pay for working 38 hours. he paid $118.51 in federal and state income taxes, and $64.75 in fica taxes. what was darren's hourly wage? question options: $17.45 $19.16 $20.57 $22.28
Answers: 3
You know the right answer?
Please help me, I really dont want to get an F :((( (The Graph Is In The Image)
The graph shows the...
Questions

English, 09.02.2022 20:50
SAT, 09.02.2022 20:50
SAT, 09.02.2022 20:50
Mathematics, 09.02.2022 20:50

Computers and Technology, 09.02.2022 20:50


SAT, 09.02.2022 20:50


Biology, 09.02.2022 20:50
Mathematics, 09.02.2022 20:50
Medicine, 09.02.2022 20:50
SAT, 09.02.2022 20:50
Mathematics, 09.02.2022 20:50
Mathematics, 09.02.2022 20:50
English, 09.02.2022 20:50


