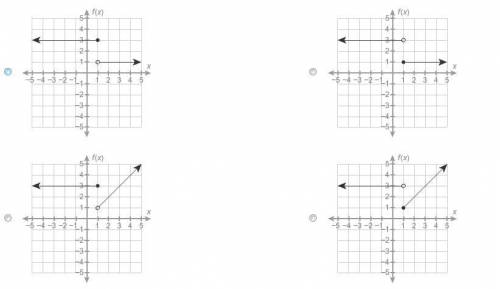
Which graph represents the function?
f(x)={3 if x<1x if x≥1
...

Mathematics, 22.10.2020 23:01 einstein101
Which graph represents the function?
f(x)={3 if x<1x if x≥1

Answers: 3


Another question on Mathematics
Mathematics, 21.06.2019 16:10
Which of the following graphs represents the function f(x) = 2^x
Answers: 2
Mathematics, 21.06.2019 23:50
4. (10.03 mc) the equation of line cd is y = −2x − 2. write an equation of a line parallel to line cd in slope-intercept form that contains point (4, 5). (4 points) y = −2x + 13 y = negative 1 over 2 x + 7 y = negative 1 over 2 x + 3 − 2x − 3
Answers: 2
Mathematics, 22.06.2019 01:00
How would you find the height of points on the circle? the topic is trigonometry.
Answers: 3
Mathematics, 22.06.2019 02:00
Will make ! for correct answer the dot plot below shows the number of toys 21 shops sold in an hour.is the median or the mean a better center for this data and why? a. median; because the data is not symmetric and there are outliersb. median; because the data is symmetric and there are no outliersc. mean; because the data is symmetric and there are no outliersd. mean; because the data is skewed and there are outliers
Answers: 2
You know the right answer?
Questions

Computers and Technology, 18.04.2021 19:00

History, 18.04.2021 19:00

English, 18.04.2021 19:00

Biology, 18.04.2021 19:00
English, 18.04.2021 19:00

Mathematics, 18.04.2021 19:00
English, 18.04.2021 19:00
History, 18.04.2021 19:00

Business, 18.04.2021 19:00


