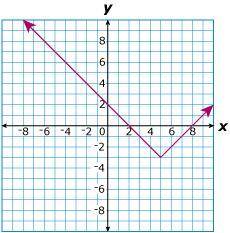
Which graph best represents the following equation?
y + 3 = |x – 5|
...

Mathematics, 23.10.2020 22:30 belindajolete
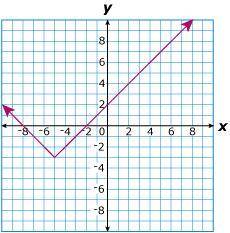
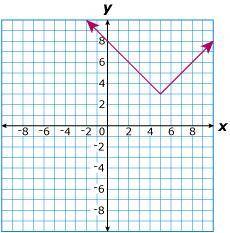
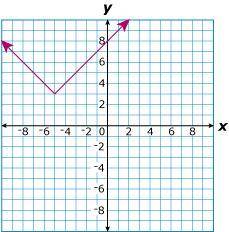
Which graph best represents the following equation?
y + 3 = |x – 5|

Answers: 1


Another question on Mathematics
Mathematics, 21.06.2019 17:30
During a bike challenge riders have to collect various colored ribbons each 1/2 mile they collect a red ribbon each eighth mile they collect a green ribbon and each quarter mile they collect a blue ribbion wich colors of ribion will be collected at the 3/4 markrer
Answers: 3
Mathematics, 21.06.2019 18:30
Select the lengths in centimeters that would form a right triangle
Answers: 1
You know the right answer?
Questions


Mathematics, 26.03.2020 01:10

History, 26.03.2020 01:10


Mathematics, 26.03.2020 01:10
Mathematics, 26.03.2020 01:11


