
Mathematics, 25.10.2020 19:40 jamya62
Please help me I suck at math and this is my only hope..
There are many measurements of the human body that are positively correlated. For example, the length of one's forearm (measured from elbow to wrist) is approximately the same length as the foot (measured from heel to toe). They are positively correlated because, as one measurement increases, so does the other measurement.
You will discover through this project whether a human's arm span (measured across the body with the arms extended) is correlated to his height.
You will need to collect data from 11 people, which will give you 12 data points including your own personal data. You will turn in and answer questions regarding only one scatter plot if doing the project alone. You may use the sample data provided in Part One if you do not have 11 people to measure.
1. Measure your own height and arm span (from finger-tip to finger-tip) in inches. You will likely need some help from a parent, guardian, or sibling to get accurate measurements. Record your measurements on the "Data Record" document. Use the "Data Record" to help you complete Part Two of this project.
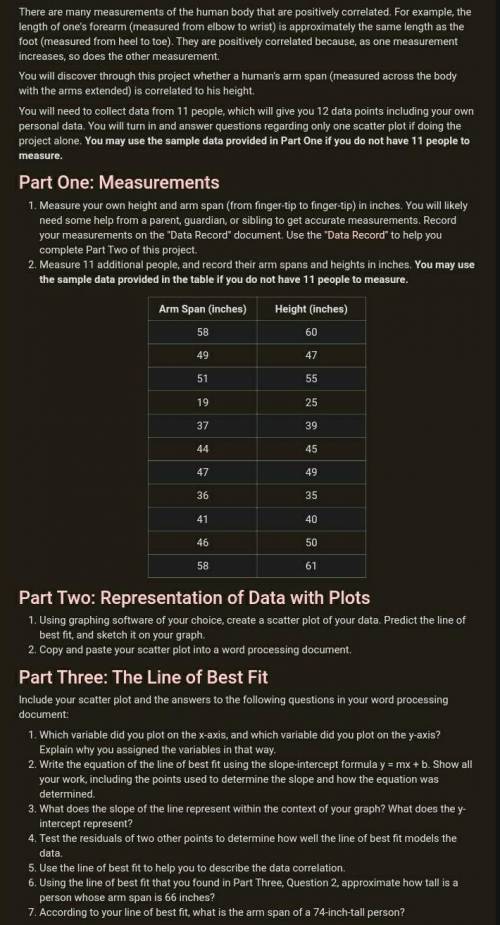
2. Measure 11 additional people, and record their arm spans and heights in inches. You may use the sample data provided in the table if you do not have 11 people to measure.
Using graphing software of your choice, create a scatter plot of your data. Predict the line of best fit, and sketch it on your graph. Copy and paste your scatter plot into a word processing document.
Include your scatter plot and the answers to the following questions in your word processing document:
Which variable did you plot on the x-axis, and which variable did you plot on the y-axis? Explain why you assigned the variables in that way. Write the equation of the line of best fit using the slope-intercept formula y = mx + b. Show all your work, including the points used to determine the slope and how the equation was determined. What does the slope of the line represent within the context of your graph? What does the y-intercept represent?Test the residuals of two other points to determine how well the line of best fit models the data. Use the line of best fit to help you to describe the data correlation. Using the line of best fit that you found in Part Three, Question 2, approximate how tall is a person whose arm span is 66 inches?According to your line of best fit, what is the arm span of a 74-inch-tall person?

Answers: 1


Another question on Mathematics
Mathematics, 21.06.2019 16:30
Triangle inequality theorem state if each set of three numbers can be the lengths of the sides of a triangle. 1. 9, 8, 22. 2. 5,10,12. 3. 7,10,22. 4. 4,11,12. 5. 11,9,10. 6. 10,4,19. 7. 3,12,10. 8. 4,3,2. 9. 6,5,13. 10. 7,12,20. me .
Answers: 3
Mathematics, 21.06.2019 19:30
Lin is writing an equation to model the proportional relationship between y, the total cost in dollars of downloading videos from a website, and x, the number of videos downloaded. she knows that the total cost to download 3 videos was $12. her work to find the equation is shown below. joylin’s work step 1 k= 3/12= 0.25 step 2 y= 0.25x where did joylin make her first error?
Answers: 2
Mathematics, 21.06.2019 20:00
In new york city at the spring equinox there are 12 hours 8 minutes of daylight. the longest and shortest days of the year very by two hours and 53 minutes from the equinox in this year the equinox falls on march 21 in this task you use trigonometric function to model the hours of daylight hours on certain days of the year in new york city a.what is the independent and dependent variables? b.find the amplitude and the period of the function. c.create a trigonometric function that describes the hours of sunlight for each day of the year. d. graph the function you build in part c. e. use the function you build in part c to find out how many fewer daylight hours february 10 will have than march 21. you may look at the calendar.
Answers: 1
Mathematics, 21.06.2019 22:30
Which of the functions below could have created this graph?
Answers: 1
You know the right answer?
Please help me I suck at math and this is my only hope..
There are many measurements of the human b...
Questions
Mathematics, 16.12.2020 03:20
Mathematics, 16.12.2020 03:20
Mathematics, 16.12.2020 03:20


Mathematics, 16.12.2020 03:20

Health, 16.12.2020 03:20

Chemistry, 16.12.2020 03:20


Mathematics, 16.12.2020 03:20
Mathematics, 16.12.2020 03:20
Mathematics, 16.12.2020 03:20


