
Mathematics, 27.10.2020 01:50 ReaFam
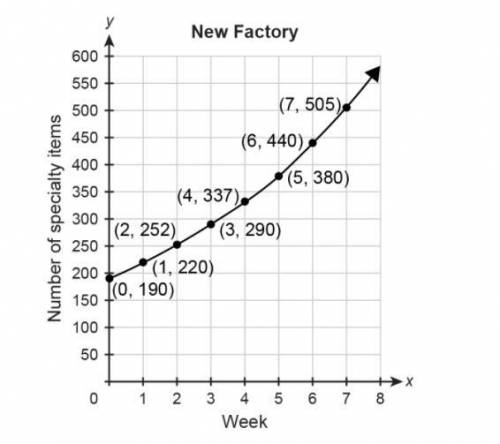
PLEASE ANSWER ASAP!! The function p(w)=230(1.1)^w represents the number of specialty items produced at the old factory w weeks after a change in management. The graph represents the number of specialty items produced at the new factory during the same time period.
(a) During Week 0, how many more specialty items were produced at the old factory than at the new factory? Explain.
(b) Find and compare the growth rates in the weekly number of specialty items produced at each factory. Show your work.
(c) When does the weekly number of specialty items produced at the new factory exceed the weekly number of specialty items produced at the old factory? Explain.

Answers: 2


Another question on Mathematics
Mathematics, 21.06.2019 19:00
Which statement best explains why ben uses the width hi to create the arc at j from point k
Answers: 2
Mathematics, 21.06.2019 19:30
In the geometric progression –3, 12, −48… what term is 3,072?
Answers: 2
Mathematics, 21.06.2019 20:50
These tables represent a quadratic function with a vertex at (0, -1). what is the average rate of change for the interval from x = 9 to x = 10?
Answers: 2
You know the right answer?
PLEASE ANSWER ASAP!! The function p(w)=230(1.1)^w represents the number of specialty items produced...
Questions
Mathematics, 05.04.2021 19:20

Mathematics, 05.04.2021 19:20

History, 05.04.2021 19:20

Arts, 05.04.2021 19:20

Advanced Placement (AP), 05.04.2021 19:20
Mathematics, 05.04.2021 19:20
English, 05.04.2021 19:20

Physics, 05.04.2021 19:20
History, 05.04.2021 19:20
Mathematics, 05.04.2021 19:20

Social Studies, 05.04.2021 19:20
History, 05.04.2021 19:20


Chemistry, 05.04.2021 19:20


