
Mathematics, 27.10.2020 19:40 selfiegymnast
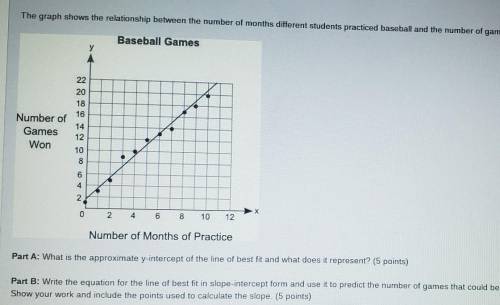
The graph shows the relationship between the number of months different students practiced baseball and the nu Baseball Games 22 18 16 Number of Games Won 12 00 6 6 2 2 6 8 10 12 Number of Months of Practice Part A: What is the approximate y-intercept of the line of best fit and what does it represent? (5 points) Part B: Write the equation for the line of best fit in slope-intercept form and use it to predict the number of games Show your work and include the points used to calculate the slope. (5 points)

Answers: 1


Another question on Mathematics
Mathematics, 21.06.2019 16:20
What are the soultion(s) to the quadratic equation 40- x^2=0
Answers: 1
Mathematics, 21.06.2019 19:30
Find the commission on a $590.00 sale if the commission is 15%.
Answers: 2
Mathematics, 21.06.2019 19:30
The wheels of a bicycle have a diameter of 70cm. how many meters will the bicycle travel if each wheel makes 50 revolutions
Answers: 2
Mathematics, 21.06.2019 20:00
Someone answer asap for ! max recorded the heights of 500 male humans. he found that the heights were normally distributed around a mean of 177 centimeters. which statements about max’s data must be true? a. the median of max’s data is 250 b. more than half of the data points max recorded were 177 centimeters. c. a data point chosen at random is as likely to be above the mean as it is to be below the mean. d. every height within three standard deviations of the mean is equally likely to be chosen if a data point is selected at random.
Answers: 1
You know the right answer?
The graph shows the relationship between the number of months different students practiced baseball...
Questions


History, 25.09.2021 20:40
Mathematics, 25.09.2021 20:40


Arts, 25.09.2021 20:40
Mathematics, 25.09.2021 20:40
Mathematics, 25.09.2021 20:40
Mathematics, 25.09.2021 20:40
Mathematics, 25.09.2021 20:40
Mathematics, 25.09.2021 20:40


