
Graph the area bounded by y< x+6 and x+3y 2 12 (6 points)
Steps:
Graph each boundary line...

Mathematics, 27.10.2020 21:10 ecenteno2004
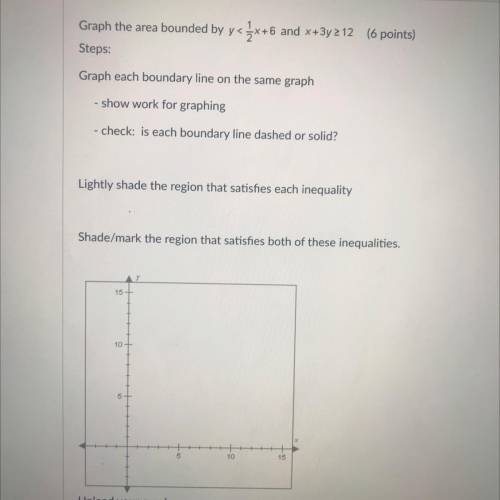
Graph the area bounded by y< x+6 and x+3y 2 12 (6 points)
Steps:
Graph each boundary line on the same graph
- show work for graphing
check: is each boundary line dashed or solid?
Lightly shade the region that satisfies each inequality
Shade/mark the region that satisfies both of these inequalities.

Answers: 2


Another question on Mathematics
Mathematics, 21.06.2019 21:30
The diagram represents the polynomial 4x2 + 23x – 72. what is the factored form of 4x2 + 23x – 72? (4x + 8)(x – 9) (4x – 8)(x + 9) (4x + 9)(x – 8) (4x – 9)(x + 8)
Answers: 2
Mathematics, 21.06.2019 21:30
Find the volume of the solid obtained by rotating the region enclosed by the curves y=1x and y=7^-x about the x-axis. (use symbolic notation and fractions where needed.) volume =
Answers: 3
You know the right answer?
Questions


Mathematics, 21.01.2021 23:10

History, 21.01.2021 23:10


Mathematics, 21.01.2021 23:10

Mathematics, 21.01.2021 23:10


