The graph below shows the number of
students in the 8th grade class. Use the
graph to answer...

Mathematics, 29.10.2020 01:40 gyexisromero10
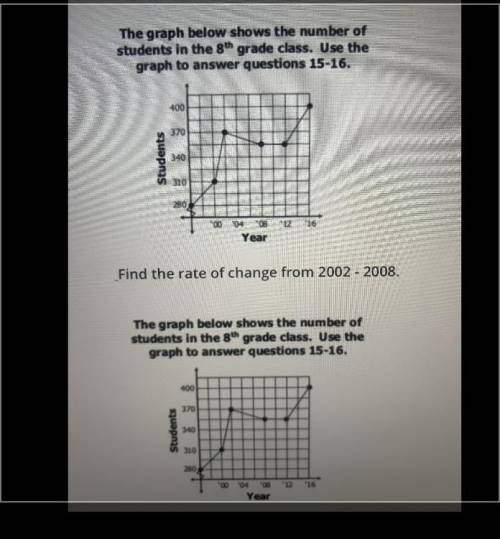
The graph below shows the number of
students in the 8th grade class. Use the
graph to answer questions 15-16.
400
370
Students
340
310
250
*0004 08 "12"16
Year
_Find the rate of change from 2002 - 2008.
The graph below shows the number of
students in the 8th grade class. Use the
graph to answer questions 15-16.
400
370
Students
310
230
*00048 "12"16
Year

Answers: 1


Another question on Mathematics
Mathematics, 22.06.2019 02:00
Pls what is the relative minimum of the function? enter your answer in the box
Answers: 3
Mathematics, 22.06.2019 03:50
Situation: find the age of the skull to the nearest year, enter the correct answer. a hiker in africa discovers a skull that contains 32% of its original amount of c- 14. done n = noekt 00000 no = inital amount of c-14 (at time t = 0) n = amount of c-14 at time t k = 0.0001 t = time, in years
Answers: 1
Mathematics, 22.06.2019 04:40
Find the solution of this system of equations -7x+y=-20 9x-3y=36
Answers: 2
You know the right answer?
Questions


Business, 03.02.2020 17:59
English, 03.02.2020 17:59


Biology, 03.02.2020 17:59
History, 03.02.2020 18:00
Chemistry, 03.02.2020 18:00

Mathematics, 03.02.2020 18:00


