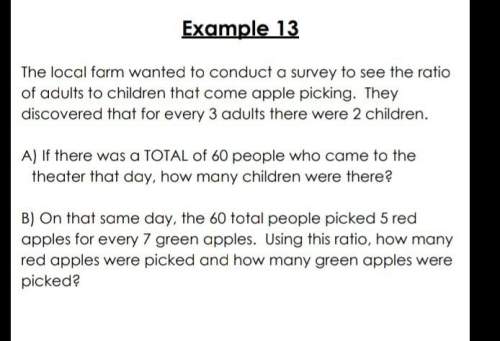
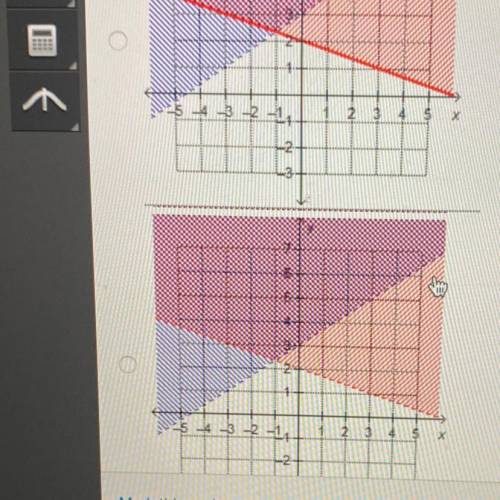
Which graph shows the solution to the system of linear inequalities?
y> 2/3x+3
y<-1/3x+...

Mathematics, 29.10.2020 20:40 taylorray0820
Which graph shows the solution to the system of linear inequalities?
y> 2/3x+3
y<-1/3x+2

Answers: 2


Another question on Mathematics
Mathematics, 21.06.2019 19:00
Simplify. −4x^2 (5x^4−3x^2+x−2) −20x^6−12x^4+8x^3−8x^2 −20x^6+12x^4−4x^3+8x^2 −20x^8+12x^4−4x^2+8x −20x^6+12x^4+4x^3−8x^2
Answers: 1
Mathematics, 21.06.2019 23:10
What is the distance between the points (2, 5) and (5,9)?
Answers: 1
Mathematics, 21.06.2019 23:30
The approximate line of best fit for the given data points, y = −2x − 2, is shown on the graph.which is the residual value when x = –2? a)–2 b)–1 c)1 d)2
Answers: 2
Mathematics, 22.06.2019 01:30
This graph shows a portion of an odd function. use the graph to complete the table of values. x f(x) −2 −3 −4 −6 im sorry i cant get the graph up
Answers: 1
You know the right answer?
Questions


Computers and Technology, 17.11.2020 17:10

Arts, 17.11.2020 17:10

Advanced Placement (AP), 17.11.2020 17:10


Mathematics, 17.11.2020 17:10
Advanced Placement (AP), 17.11.2020 17:10

Physics, 17.11.2020 17:10
Mathematics, 17.11.2020 17:10


