Mathematics, 31.10.2020 18:10 daveankatie1671
STATISTICS
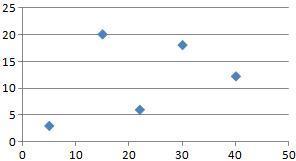
Marco is interested in the number of penguins who live on a particular ice floe. He decides to take an aerial photo of the floe and create a 20 by 20 grid on the photo. He randomly selects 3 cells and counts the number of penguins in each. He then finds the mean number of penguins for those 3 cells. Marco repeats this process for a total of 50 samples and makes a dotplot of the 50 means. This graph is an approximation of:
-stratified random sampling.
-the distribution of sample data.
-the distribution of the population.
-the sampling distribution of means.
-the sampling distribution of proportions.

Answers: 1


Another question on Mathematics

Mathematics, 21.06.2019 16:00
Fiona races bmx around a circular dirt course. if the radius of the course is 70 meters, what is the total distance fiona covers in two laps of the race? a. about 30,772 meters b. about 15,386 meters c. about 879.2 meters d. about 439.6 meters e. about 219.8 meters23 points hurry
Answers: 3

Mathematics, 21.06.2019 21:00
Mr. thompson is on a diet. he currently weighs 260 pounds. he loses 4 pounds per month. what part of the story makes the relationship not proportional?
Answers: 3

Mathematics, 21.06.2019 23:30
Graph the line with the given slope m and y-intercept b. m=-3,b=1
Answers: 1

Mathematics, 22.06.2019 00:30
Graph a point. start at your origin, move left 10 units, and then move up three units which ordered pair is the point you graphed
Answers: 2
You know the right answer?
STATISTICS
Marco is interested in the number of penguins who live on a particular ice floe. He deci...
Questions

Mathematics, 25.03.2021 23:50

Mathematics, 25.03.2021 23:50

Mathematics, 25.03.2021 23:50

Mathematics, 25.03.2021 23:50


Mathematics, 25.03.2021 23:50

Mathematics, 25.03.2021 23:50

Mathematics, 25.03.2021 23:50


Chemistry, 25.03.2021 23:50

Mathematics, 25.03.2021 23:50


Chemistry, 25.03.2021 23:50

Mathematics, 25.03.2021 23:50

Mathematics, 25.03.2021 23:50


