
Mathematics, 03.11.2020 02:30 necolewiggins1043
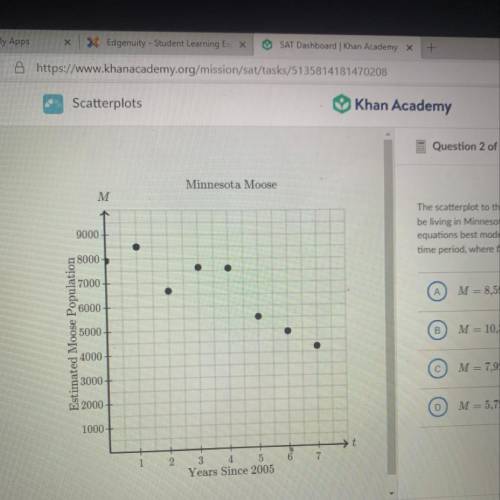
The scatterplot to the left shows the number of moose, M, estimated to
be living in Minnesota from 2005 to 2012. Which of the following
equations best models the population of moose in Minnesota during this
time period, where t represents the years since 2005?
А
M= 8,593-563t
B
M = 10,343 – 1,842t
M= 7,923 +578t
D
M=5,725 + 467

Answers: 2


Another question on Mathematics
Mathematics, 21.06.2019 14:10
An unknown number of kids and buses are getting assigned. when assigning 4 kids to each bus, there are 2 kids that aren't placed in a bus. when assigning 8 kids to each bus, there are 2 empty buses. how many total kids are there?
Answers: 1
Mathematics, 21.06.2019 19:20
Askyscraper is 396 meters tall. at a certain time of day, it casts a shadow that is 332 meters long.at what angle is the sun above the horizon at that time?
Answers: 1
Mathematics, 21.06.2019 21:20
Christine wong has asked dave and mike to her move into a new apartment on sunday morning. she has asked them both, in case one of them does not show up. from past experience, christine knows that there is a 40% chance that dave will not show up and a 30% chance that mik a. what is the probability that both dave and mike will show up? (round your answer to 2 decimal places.) b. what is the probability that at least one of them will show up? c. what is the probability that neither dave nor mike will show up? (round your answer to 2 decimal places.)e will not show up. dave and mike do not know each other and their decisions can be assumed to be independent.
Answers: 2
Mathematics, 21.06.2019 22:00
Students at a high school were asked about their favorite outdoor activity. the results are shown in the two-way frequency table below. fishing camping canoeing skiing total boys 36 44 13 25 118 girls 34 37 22 20 113 total 70 81 35 45 231 select all the statements that are true based on the given table. more girls chose camping as their favorite outdoor activity than boys. more girls chose canoeing as their favorite outdoor activity than those who chose skiing. more boys chose skiing as their favorite outdoor activity than girls. there were more boys surveyed than girls. twice as many students chose canoeing as their favorite outdoor activity than those who chose fishing. more students chose camping as their favorite outdoor activity than the combined number of students who chose canoeing or skiing.
Answers: 1
You know the right answer?
The scatterplot to the left shows the number of moose, M, estimated to
be living in Minnesota from...
Questions

Social Studies, 26.01.2021 03:20
Engineering, 26.01.2021 03:20

Mathematics, 26.01.2021 03:20

Mathematics, 26.01.2021 03:20


History, 26.01.2021 03:20
Mathematics, 26.01.2021 03:20
Mathematics, 26.01.2021 03:20
History, 26.01.2021 03:20


