 .
.
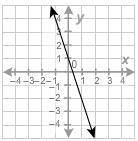
What equation is graphed in this figure?
y−4=−13(x+2)
y−3=13(x+1)
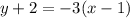
y+2=−3(x−1)...

Mathematics, 03.11.2020 21:30 gael6529
What equation is graphed in this figure?
y−4=−13(x+2)
y−3=13(x+1)
y+2=−3(x−1)
y−5=3(x−1)
Number graph ranging from negative four to four on the x and y axes. A line is drawn on the graph that passes through begin ordered pair negative one comma four end ordered pair and begin ordered pair one comma negative two end ordered pair

Answers: 1


Another question on Mathematics
Mathematics, 21.06.2019 14:30
Geometry: determine whether segment mn is parallel to segment kl. justify your answer. jm 6 mk 3 jn 8 nl 4
Answers: 1
Mathematics, 21.06.2019 17:10
Complete the table for different values of x in the polynomial expression -7x2 + 32x + 240. then, determine the optimal price that the taco truck should sell its tacos for. assume whole dollar amounts for the tacos.
Answers: 2
Mathematics, 21.06.2019 21:10
Identify the initial amount a and the growth factor b in the exponential function. a(x)=680*4.3^x
Answers: 2
You know the right answer?
Questions

Mathematics, 21.07.2020 02:01
Mathematics, 21.07.2020 02:01

Advanced Placement (AP), 21.07.2020 02:01


Mathematics, 21.07.2020 02:01
Mathematics, 21.07.2020 02:01

Computers and Technology, 21.07.2020 02:01

Spanish, 21.07.2020 02:01
Mathematics, 21.07.2020 02:01


