
Mathematics, 03.11.2020 22:20 kids2006
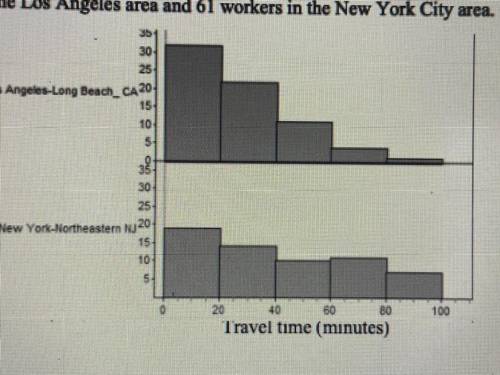
The histograms below summarize the average travel time to work for random samples of 70
workers in the Los Angeles area and 61 workers in the New York City area.
(a) Briefly compare the distributions of travel times for these two regions.
(b) Suppose you wanted to make the point that typical travel time is longer in the New York City area than in the Los Angeles area. Which measure of center would you use? Justify
your answer.

Answers: 3
 Travel time


Another question on Mathematics
Mathematics, 21.06.2019 18:50
The trigonometric ratios sine and secant are reciprocals of each other
Answers: 2
Mathematics, 22.06.2019 01:00
In a newspaper, it was reported that yearly robberies in springfield were up 25% to 265 in 2013 from 2012. how many robberies were there in springfield in 2012?
Answers: 2
You know the right answer?
The histograms below summarize the average travel time to work for random samples of 70
workers in...
Questions

English, 20.02.2021 15:10

Physics, 20.02.2021 15:10


Mathematics, 20.02.2021 15:10
Mathematics, 20.02.2021 15:10

Arts, 20.02.2021 15:10
Arts, 20.02.2021 15:10
English, 20.02.2021 15:10
History, 20.02.2021 15:20
Mathematics, 20.02.2021 15:20


Chemistry, 20.02.2021 15:20

Health, 20.02.2021 15:20


