
Mathematics, 04.11.2020 02:10 sabrinaarriagaowe3gt
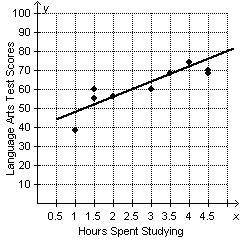
The graph below shows the hours students spent studying and their language arts test scores.
Hours Spent Studying vs. Language Arts Test Scores
A graph has hours spent studying on the x-axis and language arts test scores on the y-axis. A line goes through points (2.5, 60) and (5, 80).
Based on trend line on the graph, what is the expected test score for a student who did not study?
0.5
8
40
45

Answers: 2


Another question on Mathematics
Mathematics, 21.06.2019 18:00
Arecipe calls for 32 fluid ounces of heavy cream.how many 1 pint containers of heavy cream are needed to make the recipe?
Answers: 2
Mathematics, 21.06.2019 20:00
What are the domain and range of the function f(x)=2^x+1
Answers: 1
Mathematics, 21.06.2019 20:00
A. what does the point (4, 122) represent? b. what is the unit rate? c. what is the cost of buying 10 tickets?
Answers: 2
Mathematics, 21.06.2019 21:00
Apiling for a high-rise building is pushed by two bulldozers at exactly the same time. one bulldozer exerts a force of 1250 pounds in a westerly direction. the other bulldozer pushes the piling with a force of 2650 pounds in a northerly direction. what is the direction of the resulting force upon the piling, to the nearest degree? a. 65 n of w b. 25 n of w c. 45 n of w d. 35 n of w
Answers: 1
You know the right answer?
The graph below shows the hours students spent studying and their language arts test scores.
Hours...
Questions


History, 07.03.2021 20:50


German, 07.03.2021 20:50
Physics, 07.03.2021 20:50
Mathematics, 07.03.2021 20:50
Mathematics, 07.03.2021 20:50
Mathematics, 07.03.2021 20:50

Chemistry, 07.03.2021 20:50
Mathematics, 07.03.2021 20:50


Computers and Technology, 07.03.2021 20:50
English, 07.03.2021 20:50
Mathematics, 07.03.2021 20:50


