
Mathematics, 04.11.2020 07:30 mccartney33
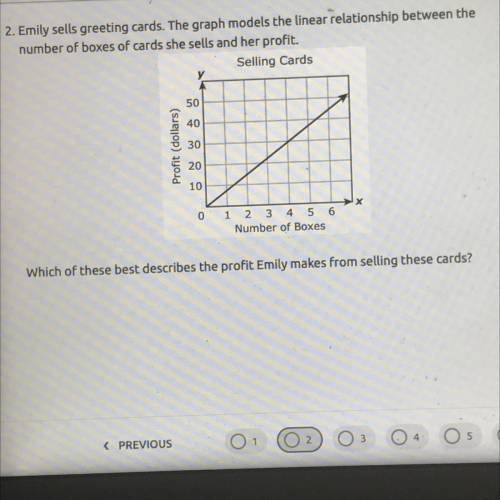
2. Emily sells greeting cards. The graph models the linear relationship between the
number of boxes of cards she sells and her profit.
Selling Cards
$4.00 per
y
50
$10.00 per
40
Profit (dollars)
30
20
$7.50 per
10
X
$3.00 per
0
1 2 3 4 5 6
Number of Boxes
CLEAR ALL
Which of these best describes the profit Emily makes from selling these cards?

Answers: 3


Another question on Mathematics
Mathematics, 21.06.2019 12:30
Seth practice piano for 1 1/3 hours on saturday and 5/6 hour on sunday for much longer did he practice on saturday than on sunday?
Answers: 1
Mathematics, 21.06.2019 16:10
To find the extreme values of a function f(x.y) on a curve x-x(t), y y(t), treat f as a function of the single variable t and use the chain rule to find where df/dt is zero. in any other single-variable case, the extreme values of f are then found among the values at the critical points (points where df/dt is zero or fails to exist), and endpoints of the parameter domain. find the absolute maximum and minimum values of the following function on the given curves. use the parametric equations x=2cos t, y 2 sin t functions: curves: i) the semicircle x4,y20 i) the quarter circle x2+y-4, x20, y20 b, g(x,y)=xy
Answers: 2
Mathematics, 21.06.2019 19:30
Two variables, x and y, vary inversely, and x=12 when y=4. what is the value of y when x=3?
Answers: 1
You know the right answer?
2. Emily sells greeting cards. The graph models the linear relationship between the
number of boxes...
Questions


Geography, 20.02.2020 01:54

Mathematics, 20.02.2020 01:54

Mathematics, 20.02.2020 01:54


Social Studies, 20.02.2020 01:55
Social Studies, 20.02.2020 01:55


