
Mathematics, 04.11.2020 23:10 sierranowe2003
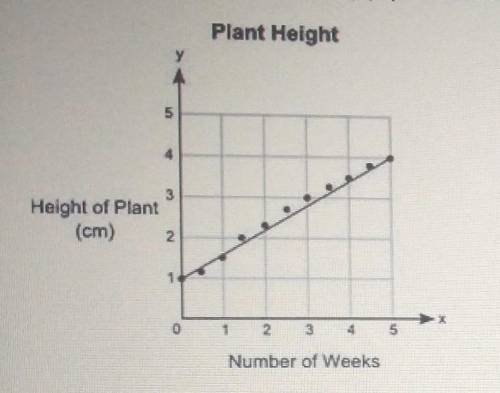
picture is the graph for the equation
The graph shows the heights, y (In centimeters), of a plant after a certain number of weeks, X. Shania drew the line of best fit on the graph. What would most likely be the approximate height of the plant after 7 weeks? (1 point)
O 5.2 centimeters
O 7.6 centimeters 8.7 centimeters
O 12.7 centimeters
O 8.7 centimeters

Answers: 3


Another question on Mathematics
Mathematics, 21.06.2019 16:10
What is the point-slope equation of a line with slope -5 that contains the point (6,3)
Answers: 1
Mathematics, 21.06.2019 20:00
Leslie started last week with $1200 in her checking account. during the week, she wrote the checks below.
Answers: 1
Mathematics, 21.06.2019 20:00
A. what does the point (4, 122) represent? b. what is the unit rate? c. what is the cost of buying 10 tickets?
Answers: 2
Mathematics, 21.06.2019 20:40
Reduce fractions expressing probability to lowest terms. in 3,000 repetitions of an experiment, a random event occurred in 500 cases. the expected probability of this event is?
Answers: 3
You know the right answer?
picture is the graph for the equation
The graph shows the heights, y (In centimeters), of a plant a...
Questions


Chemistry, 17.02.2020 02:27

Biology, 17.02.2020 02:27
Mathematics, 17.02.2020 02:28

Mathematics, 17.02.2020 02:28
Biology, 17.02.2020 02:28
Mathematics, 17.02.2020 02:28
Mathematics, 17.02.2020 02:28

English, 17.02.2020 02:28
Mathematics, 17.02.2020 02:29
History, 17.02.2020 02:29


