The dotplot below displays 26 students' scores on a 30-
point statistics quiz.
Which of the f...

Mathematics, 04.11.2020 23:30 garcikyl000
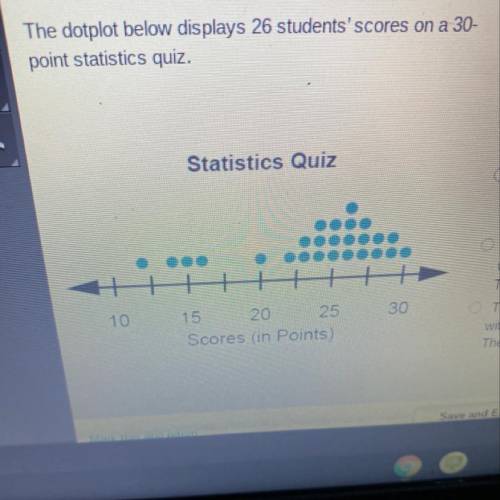
The dotplot below displays 26 students' scores on a 30-
point statistics quiz.
Which of the following statements best describes the
dotplot?
Statistics Quiz
The distribution of quiz scores is skewed left with a
center around 24 and varies from 12 to 30. There are
possible outliers at 12, 14, 15, and 16.
The distribution of quiz scores is skewed right with a
center around 24 and varies from 12 to 30. There are
possible outliers at 12, 14, 15, and 16.
The distribution of quiz scores is unimodal symmetric
with a center around 24 and varies from 12 to 30.
There are possible outliers at 12, 14, 15, and 16.
The distribution of quiz scores is unimodal symmetric
with a center around 26 and varies from 20 to 30.
There are possible outliers at 12, 14, 15, and 16.
10
30
15 20 25
Scores (in Points)

Answers: 1


Another question on Mathematics
Mathematics, 21.06.2019 18:00
What does the relationship between the mean and median reveal about the shape of the data
Answers: 1
Mathematics, 21.06.2019 18:50
The circumference of a redwood tree trunk is 20π ft, and it is 100 ft tall. what is the approximate volume of the redwood tree trunk? 1,000π ft3 10,000π ft3 4,000π ft3 40,000π ft3
Answers: 1
Mathematics, 21.06.2019 20:30
Ming says that 0.24 > 1/4 because 0.24= 2/4. which best explains mings error
Answers: 1
You know the right answer?
Questions
Mathematics, 28.04.2021 23:30

Computers and Technology, 28.04.2021 23:30

Mathematics, 28.04.2021 23:30


English, 28.04.2021 23:30
Mathematics, 28.04.2021 23:30
Mathematics, 28.04.2021 23:30

English, 28.04.2021 23:30
Mathematics, 28.04.2021 23:30

Computers and Technology, 28.04.2021 23:30


