Which inequality does the graph represent?
0 x 17
x <17
Ox $ 17
Ox>17
...

Mathematics, 05.11.2020 02:00 briannahernand2
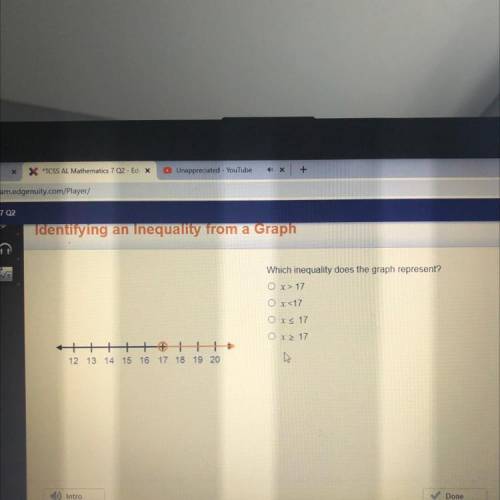
Which inequality does the graph represent?
0 x 17
x <17
Ox $ 17
Ox>17
HHH
12 13 14 15 16 17 18 19 20

Answers: 1


Another question on Mathematics
Mathematics, 21.06.2019 18:30
Do some research and find a city that has experienced population growth. determine its population on january 1st of a certain year. write an exponential function to represent the city’s population, y, based on the number of years that pass, x after a period of exponential growth. describe the variables and numbers that you used in your equation.
Answers: 3
Mathematics, 21.06.2019 22:00
Identify the expression equivalent to 4(x + x + 7) − 2x + 8 − 4 by substituting x = 1 and x = 2.
Answers: 2
You know the right answer?
Questions

Social Studies, 16.07.2019 01:30


Computers and Technology, 16.07.2019 01:30

Mathematics, 16.07.2019 01:30

History, 16.07.2019 01:30

Mathematics, 16.07.2019 01:30
Chemistry, 16.07.2019 01:30
Mathematics, 16.07.2019 01:30
Mathematics, 16.07.2019 01:30


