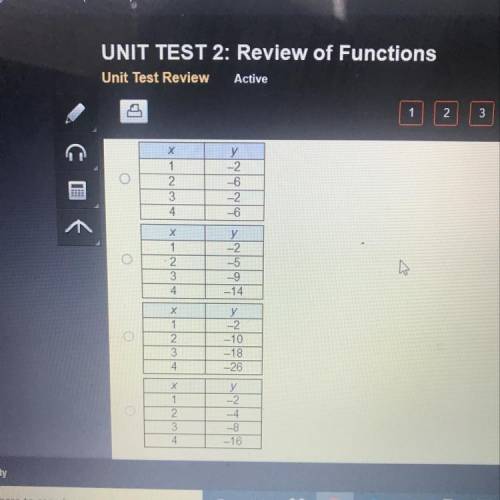
Which table represents a linear function?
X
1
2.
3
4
y
-2
...

Mathematics, 05.11.2020 20:50 KarlaOsorio7779
Which table represents a linear function?
X
1
2.
3
4
y
-2
-6
-2
-6
у
-2
х
1
2
3
4
-5
-9
-14
х
1
2
3
y
-2
-10
-18

Answers: 3


Another question on Mathematics
Mathematics, 21.06.2019 12:30
Option 1: $30 an hour plus a nonrefundable deposit of $50 option 2: $20 an hour plus a nonrefundable deposit of $75 kyle is renting a jetski for the day. if he can rent the jetski in one hour increments, what is the minimum number of hours must he rent the jetski for option 2 to be a better deal then option 1?
Answers: 1
Mathematics, 21.06.2019 15:00
Shryia read a 481 -page-long book cover to cover in a single session, at a constant rate. after reading for 1.5 hours, she had 403 pages left to read. how fast was shryia reading? pages per hour how long did it take her to read the entire book? hours plz i realy need this
Answers: 1
Mathematics, 21.06.2019 17:00
The center of a circle represent by the equation (x+9)^2+(y-6)^2=10^2 (-9,6), (-6,9), (6,-9) ,(9,-6)
Answers: 1
Mathematics, 21.06.2019 22:50
Listed below are time intervals (min) between eruptions of a geyser. assume that the "recent" times are within the past few years, the "past" times are from around 20 years ago, and that the two samples are independent simple random samples selected from normally distributed populations. do not assume that the population standard deviations are equal. does it appear that the mean time interval has changed? is the conclusion affected by whether the significance level is 0.10 or 0.01? recent 78 90 90 79 57 101 62 87 71 87 81 84 57 80 74 103 62 past 88 89 93 94 65 85 85 92 87 91 89 91 follow the steps of hypothesis testing, including identifying the alternative and null hypothesis, calculating the test statistic, finding the p-value, and making a conclusions about the null hypothesis and a final conclusion that addresses the original claim. use a significance level of 0.10. is the conclusion affected by whether the significance level is 0.10 or 0.01? answer choices below: a) yes, the conclusion is affected by the significance level because h0 is rejected when the significance level is 0.01 but is not rejected when the significance level is 0.10. b) no, the conclusion is not affected by the significance level because h0 is not rejected regardless of whether a significance level of 0.10 or 0.01 is used. c) yes, the conclusion is affected by the significance level because h0 is rejected when the significance level is 0.10 but is not rejected when the significance level is 0.01. d) no, the conclusion is not affected by the significance level because h0 is rejected regardless of whether a significance level of 0.10 or 0.01 is used.
Answers: 3
You know the right answer?
Questions


Mathematics, 09.07.2021 05:40

Chemistry, 09.07.2021 05:40

English, 09.07.2021 05:40
Mathematics, 09.07.2021 05:50

Mathematics, 09.07.2021 05:50
Mathematics, 09.07.2021 05:50
Mathematics, 09.07.2021 05:50


