
Mathematics, 05.11.2020 22:10 aupein
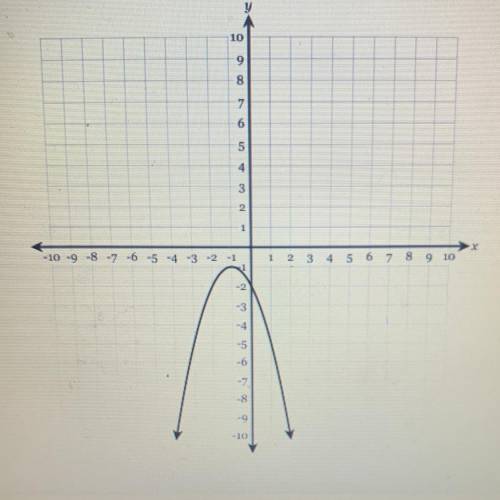
The graph of y = f(x) is shown below. Find all values of x where f(x) = -5.
Picture of graph is there
40 points casue I need this answer

Answers: 1


Another question on Mathematics
Mathematics, 21.06.2019 17:00
Alonso walked with his friend andy one day, and wanted to compare their speeds. alonso walked 3 miles in one hour, and andy walked 2 miles in 2 hours. complete the table to graph the relationship for each person.
Answers: 3
Mathematics, 21.06.2019 19:10
How many solutions does the nonlinear system of equations graphed below have?
Answers: 2
Mathematics, 21.06.2019 19:30
Consider this equation. |y + 6| = 2 what can be concluded of the equation? check all that apply. there will be one solution. there will be two solutions. the solution to –(y + 6) = 2 will be also be a solution to the given absolute value equation. the solution(s) will be the number(s) on the number line 2 units away from –6. the value of y must be positive since the variable is inside absolute value signs.
Answers: 1
You know the right answer?
The graph of y = f(x) is shown below. Find all values of x where f(x) = -5.
Picture of graph is the...
Questions
Mathematics, 27.10.2020 18:30


Mathematics, 27.10.2020 18:30
Mathematics, 27.10.2020 18:30
Mathematics, 27.10.2020 18:30

Mathematics, 27.10.2020 18:30
Mathematics, 27.10.2020 18:30
Mathematics, 27.10.2020 18:30
Mathematics, 27.10.2020 18:30

History, 27.10.2020 18:30
Mathematics, 27.10.2020 18:30
Mathematics, 27.10.2020 18:30


