
Mathematics, 06.11.2020 18:30 robbyd47
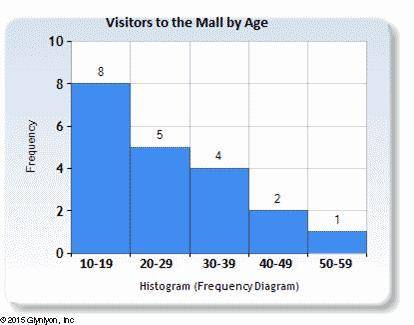
This histogram represents a sampling of recent visitors to the mall on a Friday night, grouped by their ages. If you knew the exact values of the data points for this data set, which measure of center (the mean or median) would most likely provide a more accurate picture of the data set? Explain your reasoning.

Answers: 2


Another question on Mathematics
Mathematics, 21.06.2019 13:20
Suppose that x and y are both differentiable functions of t and are related by the given equation. use implicit differentiation with respect to t to determine startfraction dy over dt endfraction in terms of x, y, and startfraction dx over dt endfraction .
Answers: 3
Mathematics, 21.06.2019 17:10
Empty box + box + empty box fill in the box is equal to 30 how
Answers: 2
Mathematics, 21.06.2019 17:30
Daniel bought a computer game for $25 and later sold it to thomas for a 40% profit. how much did daniel sell the computer game for?
Answers: 1
Mathematics, 21.06.2019 21:00
Consider the polynomials given below. p(x) = x4 + 3x3 + 2x2 – x + 2 q(x) = (x3 + 2x2 + 3)(x2 – 2) determine the operation that results in the simplified expression below. 35 + x4 – 573 - 3x2 + x - 8 a. p+q b. pq c.q-p d. p-q
Answers: 2
You know the right answer?
This histogram represents a sampling of recent visitors to the mall on a Friday night, grouped by th...
Questions
Mathematics, 27.08.2021 21:40


Biology, 27.08.2021 21:40

History, 27.08.2021 21:40
Mathematics, 27.08.2021 21:40


Mathematics, 27.08.2021 21:40
Mathematics, 27.08.2021 21:40
English, 27.08.2021 21:40

Physics, 27.08.2021 21:40


