
Mathematics, 06.11.2020 18:50 juandguardado7045
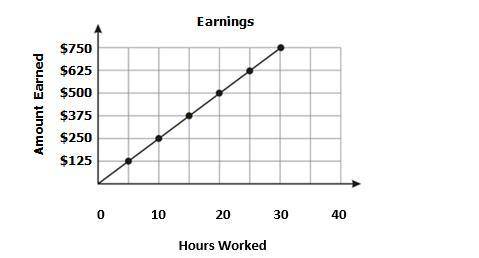
The graph represents the amount a waiter earns over time.
According to the graph, what is the constant of proportionality?
A. The waiter earns $25 an hour.
B. The waiter earns $20 an hour.
C. The waiter earns $15 an hour.
D. The waiter earns $10 an hour.

Answers: 1


Another question on Mathematics
Mathematics, 21.06.2019 19:00
Since opening night, attendance at play a has increased steadily, while attendance at play b first rose and then fell. equations modeling the daily attendance y at each play are shown below, where x is the number of days since opening night. on what day(s) was the attendance the same at both plays? what was the attendance? play a: y = 8x + 191 play b: y = -x^2 + 26x + 126 a. the attendance was never the same at both plays. b. the attendance was the same on day 5. the attendance was 231 at both plays on that day. c. the attendance was the same on day 13. the attendance was 295 at both plays on that day. d. the attendance was the same on days 5 and 13. the attendance at both plays on those days was 231 and 295 respectively.
Answers: 1
Mathematics, 21.06.2019 22:00
Set $r$ is a set of rectangles such that (1) only the grid points shown here are used as vertices, (2) all sides are vertical or horizontal and (3) no two rectangles in the set are congruent. if $r$ contains the maximum possible number of rectangles given these conditions, what fraction of the rectangles in set $r$ are squares? express your answer as a common fraction.
Answers: 1
Mathematics, 22.06.2019 01:00
The equation line of cd is y=-2x-2. write an equation of a line parallels to line cd in slope-intercept form that contains point (4,5)
Answers: 1
Mathematics, 22.06.2019 02:30
Hurry the figure shows the front side of a metal desk in the shape of a trapezoid.what is the area of this trapezoid? 10 ft²16 ft²32 ft²61 ft²
Answers: 3
You know the right answer?
The graph represents the amount a waiter earns over time.
According to the graph, what is the const...
Questions


Physics, 12.12.2019 18:31
History, 12.12.2019 18:31
Mathematics, 12.12.2019 18:31


Geography, 12.12.2019 18:31

Chemistry, 12.12.2019 18:31
English, 12.12.2019 18:31
Mathematics, 12.12.2019 18:31
Mathematics, 12.12.2019 18:31

Mathematics, 12.12.2019 18:31


