
Mathematics, 06.11.2020 20:10 guest7514
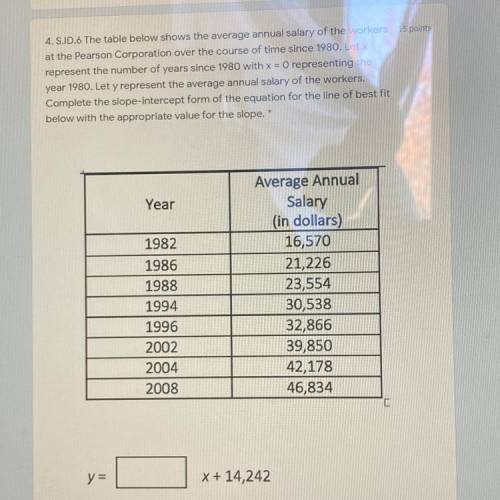
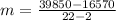
The table below shows the average annual salary of the workers at the Pearson
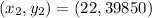
Corporation over the course of time since 1980. Let x represent the number of years
since 1980 with x = 0
representing the year 1980. Let y represent the average annual
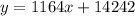
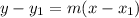
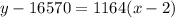
salary of the workers. Complete the slope-intercept form of the equation for the line of
best fit below with the appropriate value for the slope.

Answers: 2


Another question on Mathematics
Mathematics, 20.06.2019 18:04
Ineed or else im in trouble need a random sample of 240 park users were asked if they go to the park more often on weekdays or on the weekend. the results are shown in the table. weekdays weekend male (50) (10) female (150) (30) based on the data in the table, select correct or incorrect for each statement. correct or incorrect 1.the males go to the park more often on the weekend. 2.the females go to the park more often on weekdays. 3.for the participants in the survey, gender affects which days of the week a person goes to the park.
Answers: 1
Mathematics, 21.06.2019 18:00
Need on this geometry question. explain how you did it.
Answers: 2
Mathematics, 21.06.2019 18:30
Complex numbers multiply √-4 * √-25 and show all intermediate steps. alternative notation is sqrt(-4) * sqrt(-25).
Answers: 1
Mathematics, 21.06.2019 21:00
Need match the functions with correct transformation. f(x) = -3x f(x) = |x-1|+3 f(x) = √(x+3) 1/2x² f(x) = (x+1)²-3 4|x| 1. compress by a factor of 1/2 2. stretch by a factor of 4 3. shift to the left 3 4. shift to the left 1 5. shift up 3 6. reflection
Answers: 1
You know the right answer?
The table below shows the average annual salary of the workers at the Pearson
Corporation over the...
Questions

Geography, 29.09.2019 00:10
Geography, 29.09.2019 00:10
Geography, 29.09.2019 00:10


