Lesson 5 Extra Practice
Drag the dots onto the graph at the
Graph Proportional Relationships...

Mathematics, 06.11.2020 23:40 rajenkins79
Lesson 5 Extra Practice
Drag the dots onto the graph at the
Graph Proportional Relationships the table and then drag the line to
correct spot to plot each point from
connect the dots.
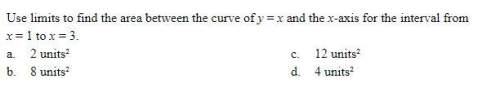
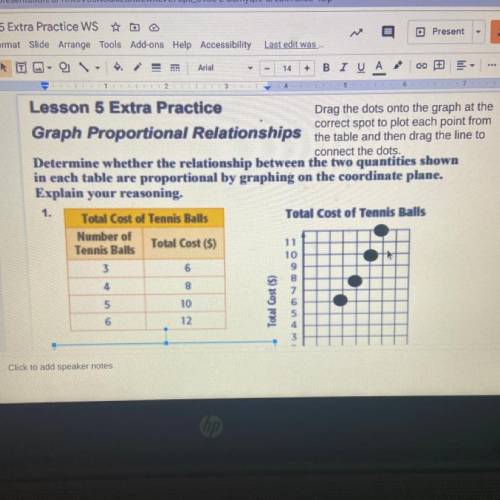
Determine whether the relationship between the two quantities shown
in each table are proportional by graphing on the coordinate plane.
Explain your reasoning.
1.
Total Cost of Tennis Balls
Total Cost of Tennis Balls
Number of
Total Cost (5)
Tennis Balls
10
3
6
4
8
11
9
8
7
6
5
5
10
Total Cost (5)
6
12
3

Answers: 3


Another question on Mathematics
Mathematics, 21.06.2019 22:10
To prove that angle def = angle dgf by sas, what additional information is needed? def congruent to dgf dfe congruent to dfg de congruent to dg dg congruent to gf
Answers: 1
Mathematics, 21.06.2019 23:00
The equation shown below represents function f. f(x)= -2x+5 the graph shown below represents function g. which of the following statements is true? a. over the interval [2, 4], the average rate of change of f is the same as the average rate of change of g. the y-intercept of function f is less than the y-intercept of function g. b. over the interval [2, 4], the average rate of change of f is greater than the average rate of change of g. the y-intercept of function f is greater than the y-intercept of function g. c. over the interval [2, 4], the average rate of change of f is the same as the average rate of change of g. the y-intercept of function f is greater than the y-intercept of function g. d. over the interval [2, 4], the average rate of change of f is less than the average rate of change of g. the y-intercept of function f is the same as the y-intercept of function g.
Answers: 1
Mathematics, 21.06.2019 23:30
Astudent must have an average on five test that is greater than it equal to 80% but less than 90% to receive a final grade of b. devon's greades on the first four test were 78% 62% 91% and 80% what range if grades on the fifth test would give him a b in the course? ( assuming the highest grade is 100%)
Answers: 1
You know the right answer?
Questions

History, 26.04.2021 23:30

Mathematics, 26.04.2021 23:30
Mathematics, 26.04.2021 23:30

Physics, 26.04.2021 23:30
Mathematics, 26.04.2021 23:30

Physics, 26.04.2021 23:30
Physics, 26.04.2021 23:30
Mathematics, 26.04.2021 23:30
Mathematics, 26.04.2021 23:30
Mathematics, 26.04.2021 23:30
History, 26.04.2021 23:30
English, 26.04.2021 23:30


