
Mathematics, 09.11.2020 03:00 destinyycooper
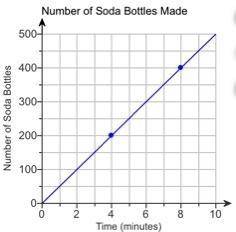
The graph shows the relationship between time and the number of soda bottles a machine can make. Use the points (,) and (,) to find the number of soda bottles the machine can make each minute. Number of Soda Bottles Made 0 2 4 6 8 10 0 100 200 300 400 500 Time (minutes) Number of Soda Bottles A coordinate plane titled Number of Soda Bottles Made is shown. A horizontal axis is labeled Time (minutes) from 0 to 10. A vertical axis is labeled Number of Soda Bottles from 0 to 500. A line rises from left to right starting at the origin, (0, 0), and passes through plotted points (4, 200) and (8, 400). The machine can make nothing soda bottles each minute.

Answers: 1


Another question on Mathematics
Mathematics, 21.06.2019 13:30
12. decide whether each statement is always true, sometimes true, or never true. a. when corresponding points of an original figure and its reflection are connected, the resulting segments are all perpendicular to the line of reflection. b. when a point is reflected over a horizontal line, the y-coordinate of the point stays the same. answer both questions and explain
Answers: 2
Mathematics, 21.06.2019 19:30
Which table shows a proportional relationship between miles traveled and gas used?
Answers: 2
Mathematics, 21.06.2019 20:30
A. plot the data for the functions f(x) and g(x) on a grid and connect the points. x -2 -1 0 1 2 f(x) 1/9 1/3 1 3 9 x -2 -1 0 1 2 g(x) -4 -2 0 2 4 b. which function could be described as exponential and which as linear? explain. c. if the functions continue with the same pattern, will the function values ever be equal? if so, give estimates for the value of x that will make the function values equals. if not, explain why the function values will never be equal.
Answers: 3
You know the right answer?
The graph shows the relationship between time and the number of soda bottles a machine can make. Use...
Questions

Mathematics, 10.04.2020 20:53


Mathematics, 10.04.2020 20:53
History, 10.04.2020 20:53
Social Studies, 10.04.2020 20:53

Computers and Technology, 10.04.2020 20:53
Mathematics, 10.04.2020 20:53


Mathematics, 10.04.2020 20:54
Mathematics, 10.04.2020 20:54


