
Mathematics, 18.11.2019 04:31 DivineMemes420
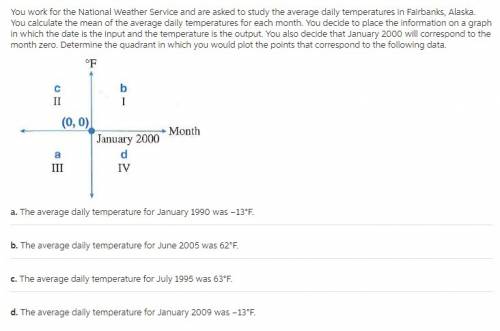
You work for the national weather service and are asked to study the average daily temperatures in anchorage, alaska. you calculate the mean of the average daily temperatures for each month. you decide to place the information on a graph in whwill correspond to the month 0 as indicated by the dot on the input scale. ich the date is the input and the temperature is the output. you also decide that january 1950

Answers: 1


Another question on Mathematics
Mathematics, 21.06.2019 17:00
The variable in a relation who’s value depends on the value of the independent variable is called what?
Answers: 1
Mathematics, 21.06.2019 17:00
Find an equation for the linear function which has slope -10 and x-intercept -7
Answers: 1
Mathematics, 21.06.2019 19:00
Solving systems of linear equations: tables represent two linear functions in a systemöwhat is the solution to this system? 0 (10)0 (1.6)0 18,26)0 18-22)
Answers: 1
You know the right answer?
You work for the national weather service and are asked to study the average daily temperatures in a...
Questions

History, 18.09.2019 03:20

English, 18.09.2019 03:20
History, 18.09.2019 03:20

English, 18.09.2019 03:20
History, 18.09.2019 03:20

Social Studies, 18.09.2019 03:20


