This line graph shows Social Security spending has
_ from 2012 to 2015.
To determine Social S...

Mathematics, 10.11.2020 03:00 tishfaco5000
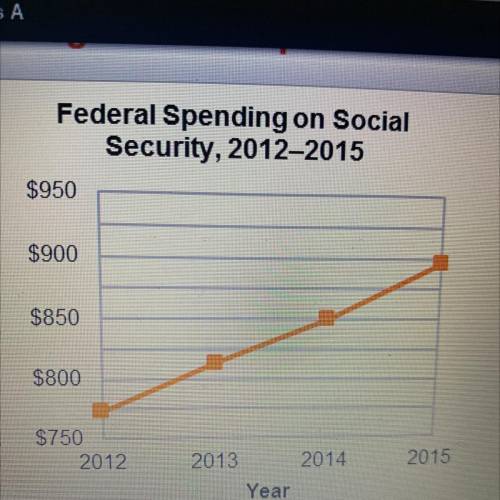
This line graph shows Social Security spending has
_ from 2012 to 2015.
To determine Social Security spending in 2014, the
year must first be located by using the_
In 2014, the federal government spent about _ on Social Security.
This chart would be most useful to show_ Social Security spending.
THIS IS FOR EDGEUNITY!

Answers: 3


Another question on Mathematics
Mathematics, 21.06.2019 17:30
Astudent survey asked: "how tall are you (in inches)? " here's the data: 67, 72, 73, 60, 65, 86, 72, 69, 74 give the five number summary. a. median: 73, mean: 70.89, iqr: 5, min: 60, max: 74 b. 60, 66, 72, 73.5, 86 c. 60, 67, 72, 73, 74 d. 0, 60, 70, 89, 74, 100
Answers: 3
Mathematics, 21.06.2019 21:30
Name and describe the three most important measures of central tendency. choose the correct answer below. a. the mean, sample size, and mode are the most important measures of central tendency. the mean of a data set is the sum of the observations divided by the middle value in its ordered list. the sample size of a data set is the number of observations. the mode of a data set is its highest value in its ordered list. b. the sample size, median, and mode are the most important measures of central tendency. the sample size of a data set is the difference between the highest value and lowest value in its ordered list. the median of a data set is its most frequently occurring value. the mode of a data set is sum of the observations divided by the number of observations. c. the mean, median, and mode are the most important measures of central tendency. the mean of a data set is the product of the observations divided by the number of observations. the median of a data set is the lowest value in its ordered list. the mode of a data set is its least frequently occurring value. d. the mean, median, and mode are the most important measures of central tendency. the mean of a data set is its arithmetic average. the median of a data set is the middle value in its ordered list. the mode of a data set is its most frequently occurring value.
Answers: 3
Mathematics, 22.06.2019 03:30
In 2000 the average price of a football ticket was $48.28. during the next 4 years, the proce increased an average of 6% each year.a) write a model giving the average price (p), in dollars, of a ticket (t) in years after 2000.b) graph the model. estimate the year when the average ticket price was about $60
Answers: 1
You know the right answer?
Questions

History, 20.11.2020 01:40

Business, 20.11.2020 01:40

Geography, 20.11.2020 01:40
Mathematics, 20.11.2020 01:40
Mathematics, 20.11.2020 01:40
Mathematics, 20.11.2020 01:40
Mathematics, 20.11.2020 01:40
Mathematics, 20.11.2020 01:40


Health, 20.11.2020 01:40
Mathematics, 20.11.2020 01:40
Mathematics, 20.11.2020 01:40
Mathematics, 20.11.2020 01:40


