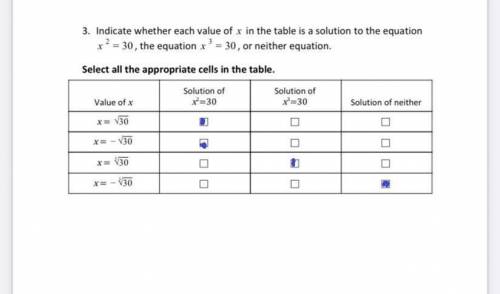
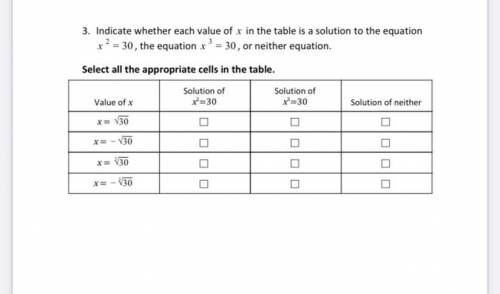
If you can’t answer this may you explain plz (added photo)
...

Mathematics, 10.11.2020 22:30 alinegonzalez0027
If you can’t answer this may you explain plz (added photo)

Answers: 1


Another question on Mathematics
Mathematics, 22.06.2019 00:00
During the election for class president, 40% of the students voted for kellen, and 60% of the students voted for robbie. 500 students voted in total. how many more students voted for robbie than for kellen? answer with work : )
Answers: 1
Mathematics, 22.06.2019 01:10
|z| > (1/2) {-1/2, 1/2} {z|(-1/2) < z < (1/2)} {z|z < (-1/2) ∪ z > (1/2)}
Answers: 3
Mathematics, 22.06.2019 02:00
Need to finish my juan wants to build a greenhouse in his back yard. he needs to maximize the ratio of floor area to structure volume in order to provide the most room for plants while minimizing the area to be heated. find the description of the structure that best meets juan’s criteria. a.) a hemisphere with a diameter of 12 feet b.) a cube with a side length of 12 feet c.) a cone with a diameter of 12 feet and a height of 10 feet d.) a square pyramid with a base side length of 12 feet and a height of 9 feet
Answers: 2
Mathematics, 22.06.2019 02:00
1. the manager of collins import autos believes the number of cars sold in a day (q) depends on two factors: (1) the number of hours the dealership is open (h) and (2) the number of salespersons working that day (s). after collecting data for two months (53 days), the manager estimates the following log-linear model: q 4 equation 1 a. explain, how to transform the log-linear model into linear form that can be estimated using multiple regression analysis. the computer output for the multiple regression analysis is shown below: q4 table b. how do you interpret coefficients b and c? if the dealership increases the number of salespersons by 20%, what will be the percentage increase in daily sales? c. test the overall model for statistical significance at the 5% significance level. d. what percent of the total variation in daily auto sales is explained by this equation? what could you suggest to increase this percentage? e. test the intercept for statistical significance at the 5% level of significance. if h and s both equal 0, are sales expected to be 0? explain why or why not? f. test the estimated coefficient b for statistical significance. if the dealership decreases its hours of operation by 10%, what is the expected impact on daily sales?
Answers: 2
You know the right answer?
Questions


Mathematics, 02.12.2020 17:10
Mathematics, 02.12.2020 17:10
Mathematics, 02.12.2020 17:10

History, 02.12.2020 17:10
Mathematics, 02.12.2020 17:10
English, 02.12.2020 17:10

History, 02.12.2020 17:10


