
Mathematics, 11.11.2020 20:50 skyvargasov9cad
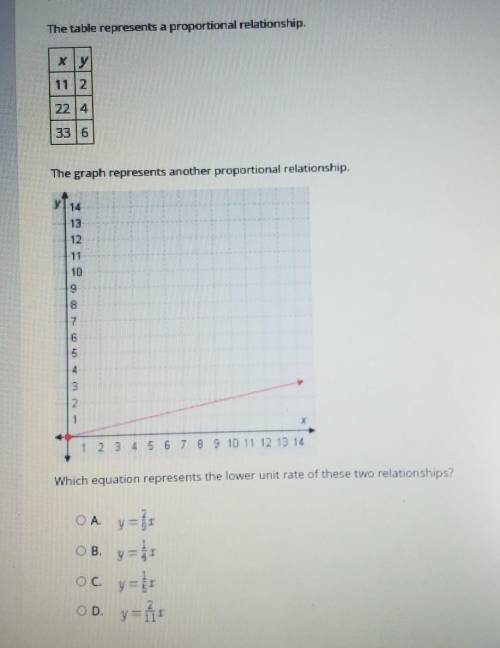
Select the correct answer. The table represents a proportional relationship, The graph represents another proportional relationship. ... 9 Which equation represents the lower unt rate of these two relationship. sorry if any of these are spelled wrong I did the scan thing. please help

Answers: 3


Another question on Mathematics
Mathematics, 21.06.2019 15:20
Angle mno is s rotated 180 degrees counterclockwise about the origin to form angle m’n’o’. which statement shows the measure of angle m’n’o’?
Answers: 1
Mathematics, 21.06.2019 15:30
The table respent two linear functions the equation respented by the first tables is given
Answers: 2
Mathematics, 21.06.2019 17:00
Find the value of the variable and the length of each secant segment.
Answers: 1
Mathematics, 21.06.2019 18:20
Inez has a phone card. the graph shows the number of minutes that remain on her phone card a certain number of days.
Answers: 2
You know the right answer?
Select the correct answer. The table represents a proportional relationship, The graph represents an...
Questions


Mathematics, 05.08.2019 01:00
Biology, 05.08.2019 01:00

Chemistry, 05.08.2019 01:00

Biology, 05.08.2019 01:00

Mathematics, 05.08.2019 01:00


