
Mathematics, 11.11.2020 22:30 RayOfSunsh1ne
Elect the correct answer from each drop-down menu.
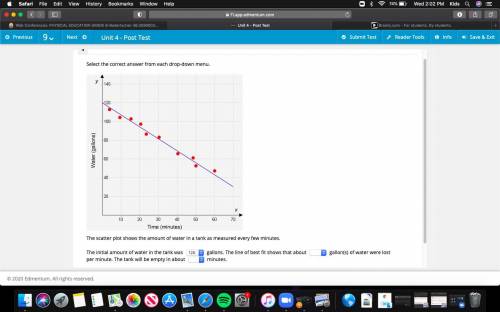
The scatter plot shows the amount of water in a tank as measured every few minutes.
The initial amount of water in the tank was gallons. The line of best fit shows that about gallon(s) of water were lost per minute. The tank will be empty in about minutes.

Answers: 1


Another question on Mathematics
Mathematics, 21.06.2019 13:30
Which equation represents a proportional relationship that has a constant of proportionality equal to 1/5
Answers: 1
Mathematics, 21.06.2019 16:50
If the table of the function contains exactly two potential turning points, one with an input value of –1, which statement best describes all possible values of m? m ≥ –12 –12 < m < 4 m ≤ 4 m ≥ 4 or m ≤ –12
Answers: 1
Mathematics, 21.06.2019 17:00
Shane can shovel the driveway in 4 hours, but if his sister it would take 2 hours. how long would it take taylor to shovel the driveway alone
Answers: 1
You know the right answer?
Elect the correct answer from each drop-down menu.
The scatter plot shows the amount of water in a...
Questions

Health, 24.02.2020 21:20


Computers and Technology, 24.02.2020 21:20
Computers and Technology, 24.02.2020 21:21

Mathematics, 24.02.2020 21:21


