subject
Mathematics, 12.11.2020 04:00 anggar20

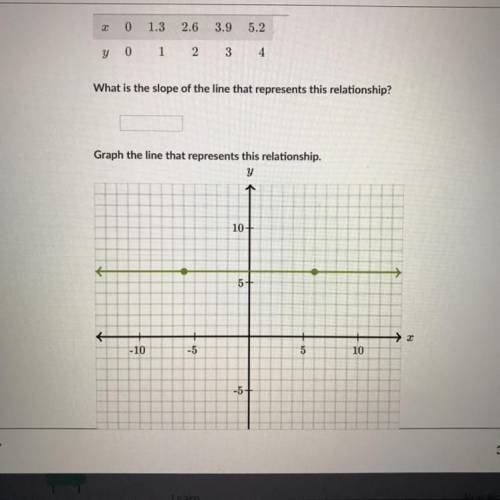
A proportional relationship is shown in the table below: x:
0
1.3
2.6
3.9
5.2
y:
0
1
2
3
4.
What is the slope of the line that represents this relationship?
Graph the line that represents this relationship.


A proportional relationship is shown in the table below:

x:
0
1.3
2.6
3.9
5.2
y:
0 
1
2
3
4.
What

ansver
Answers: 1

Another question on Mathematics

question
Mathematics, 21.06.2019 19:30
Atemperature of 1.64◦f corresponds to answer in units of ◦c.
Answers: 1
question
Mathematics, 21.06.2019 23:10
What is the distance between the points (2, 5) and (5,9)?
Answers: 1
question
Mathematics, 22.06.2019 04:30
The maximum distance (in nautical miles) that a radio transmitter signal can be sent is represented by the expression 1.23h√, where h is the height (in feet) above the transmitter. estimate the maximum distance x (in nautical miles) between the plane that is receiving the signal and the transmitter. round your answer to the nearest tenth.
Answers: 1
question
Mathematics, 22.06.2019 04:30
Plz me so yeah i rly don't get this
Answers: 1
You know the right answer?
A proportional relationship is shown in the table below: x:
0
1.3
2.6
3.9
Questions
Questions on the website: 13722367