
Mathematics, 12.11.2020 05:10 krisik
Please help me I will give you the brain thing and extra points. image below
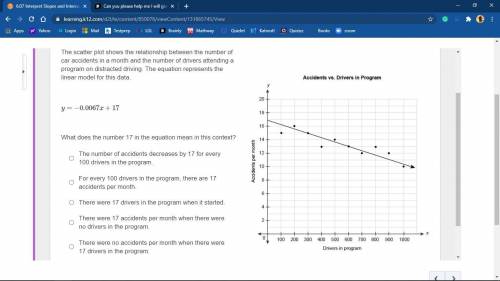
The scatter plot shows the relationship between the number of car accidents in a month and the number of drivers attending a program on distracted driving. The equation represents the linear model for this data.
y=−0.0067x+17
What does the number 17 in the equation mean in this context?
A. The number of accidents decreases by 17 for every 100 drivers in the program.
B. For every 100 drivers in the program, there are 17 accidents per month.
C. There were 17 drivers in the program when it started.
D. There were 17 accidents per month when there were no drivers in the program.
E. There were no accidents per month when there were 17 drivers in the program.

Answers: 2


Another question on Mathematics
Mathematics, 21.06.2019 16:00
When turned about its axis of rotation, which shape could have created this three-dimensional object?
Answers: 3
Mathematics, 22.06.2019 01:00
The graph shows how many words per minute two students read. drag to the table the unit rate that matches each graph.
Answers: 2
Mathematics, 22.06.2019 01:00
What is the slope of the line? a. -5/2 b.2/5 c. 5/2 d.7/2
Answers: 1
You know the right answer?
Please help me I will give you the brain thing and extra points. image below
The scatter plot shows...
Questions


Chemistry, 02.09.2020 18:01
SAT, 02.09.2020 18:01

Social Studies, 02.09.2020 18:01
Mathematics, 02.09.2020 18:01


Biology, 02.09.2020 18:01


