The following line graph shows the attendance at an annual event from 1998

Mathematics, 13.11.2020 01:30 stevenabdullatif16
Se Home
ework
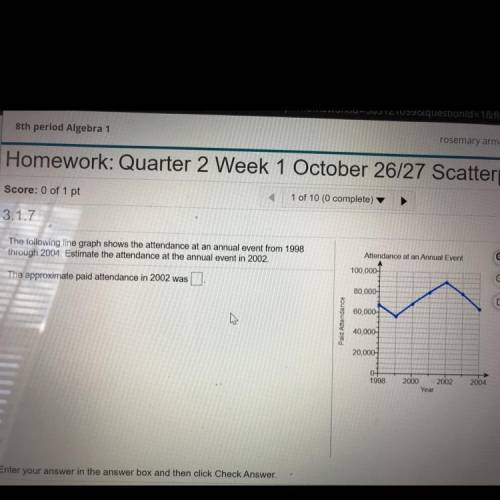
The following line graph shows the attendance at an annual event from 1998
through 2004. Estimate the attendance at the annual event in 2002,
The approximate paid attendance in 2002 was.
Attendance at an Annual Event
100,000
zes & Tests
Q
80,000
dy Plan
60.000
Paid Attendance
debook
40,000
20.000
apter Contents
0-
1998
ols for Success
2000
2002
Year
2004
ultimedia Librai
earson Tutor
ervices

Answers: 1


Another question on Mathematics
Mathematics, 21.06.2019 23:30
Identify the slope an intercept of the following linear equation y = 1/5x - 6 a. slope: 1/5; intercept: -6 b. slope: 5; intercept: -6 c. slope: -1/5; intercept: 6 d. slope: 1/5; intercept: 6
Answers: 2
Mathematics, 22.06.2019 00:30
Astudent was asked to find the square of 7x+3. the student quickly wrote (7x+3)^3= 49x^2+9. identify the student's error and provide the correct answer.
Answers: 3
Mathematics, 22.06.2019 01:00
Urgent? will give brainliest to the first correct answer what is the area of the figure?
Answers: 3
You know the right answer?
Se Home
ework
The following line graph shows the attendance at an annual event from 1998
The following line graph shows the attendance at an annual event from 1998
Questions
Mathematics, 22.04.2020 20:50
Mathematics, 22.04.2020 20:50
Mathematics, 22.04.2020 20:51
Mathematics, 22.04.2020 20:51


History, 22.04.2020 20:51


Mathematics, 22.04.2020 20:52
History, 22.04.2020 20:52


