
Mathematics, 13.11.2020 17:40 rodriguezscarlet1713
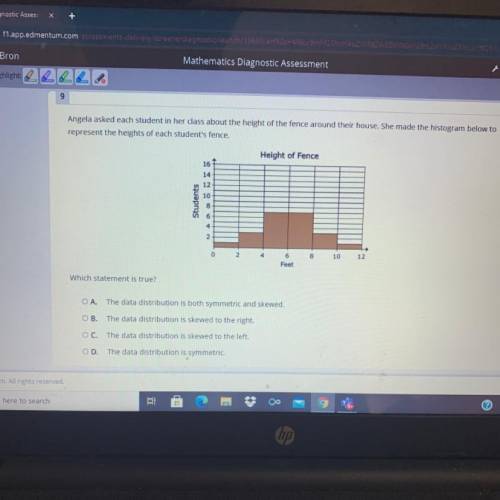
Angela asked each student in her class about the height of the fence around their house. She made the histogram below to
represent the heights of each student's fence.
Height of Fence
16
14
12
10
Students
8
6
4
2
8
10
12
6
Feet
Which statement is true?
OA. The data distribution is both symmetric and skewed.
OB. The data distribution is skewed to the right.
OC. The data distribution is skewed to the left.
OD. The data distribution is symmetric.

Answers: 1


Another question on Mathematics
Mathematics, 21.06.2019 22:00
If the altitude is drawn to the hypotenuse of a right triangle, then the two triangles formed are similar to the original triangle and to each other. which set of triangles shows the similar triangles created by the altitude in the diagram?
Answers: 3
Mathematics, 22.06.2019 00:00
Macy spent $36 on jeans. this was $12 less than twice what she spent on a shirt. which equation to solve this, 12x=36 2x=36-12 2x-12=36 12-2x=36
Answers: 1
You know the right answer?
Angela asked each student in her class about the height of the fence around their house. She made th...
Questions

Mathematics, 26.04.2021 22:30

Mathematics, 26.04.2021 22:30
Mathematics, 26.04.2021 22:30

Arts, 26.04.2021 22:30
Mathematics, 26.04.2021 22:30
Mathematics, 26.04.2021 22:30

Mathematics, 26.04.2021 22:30
Mathematics, 26.04.2021 22:30
Mathematics, 26.04.2021 22:30
Mathematics, 26.04.2021 22:30


