
Mathematics, 13.11.2020 22:50 reycaden
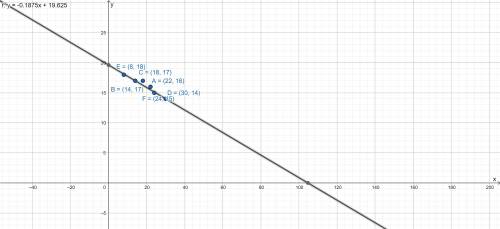
The table shows the mileages x (in thousands of miles) and the selling prices y (in thousands of dollars) of several used automobiles of the same year and model.
Mileage, x: 22 14 18 30 8 24
Price, y: 16 17 17 14 18 15
a.) Use a graphing calculator to find the equation of the line of best fit. Round the slope to the nearest tenth and y-intercept to the nearest integer.
y=
b.) Identify the correlation coefficient. Round to the nearest thousandth.
r=
Interpret the correlation coefficient.
the data show a ___ ___ correlation.

Answers: 1


Another question on Mathematics
Mathematics, 20.06.2019 18:02
Allie answered 72% of the questions on her math test correctly. if she answered 18 questions correctly, how many questions were on the test?
Answers: 1
Mathematics, 21.06.2019 16:20
Abby is preparing fruit punch for her party. she starts with a bowl filled with liquid that has 1/2 fruit juice and 1/2 sprite, but she decides it's too fruity. so she pours out 1/4 of the liquid, and then fills the bowl up again with sprite. what fraction of the punch is now sprite?
Answers: 1
Mathematics, 21.06.2019 19:00
Which shows the correct substitution of the values a,b and c from the equation 1=-2x+3x^2+1
Answers: 1
Mathematics, 21.06.2019 19:30
Identify the number 127 as a rational or irrational. explain
Answers: 2
You know the right answer?
The table shows the mileages x (in thousands of miles) and the selling prices y (in thousands of dol...
Questions


Social Studies, 12.11.2020 17:20
Mathematics, 12.11.2020 17:20

English, 12.11.2020 17:20

Biology, 12.11.2020 17:20
Mathematics, 12.11.2020 17:20
English, 12.11.2020 17:20

Mathematics, 12.11.2020 17:20


