
Mathematics, 14.11.2020 01:00 lehbug01
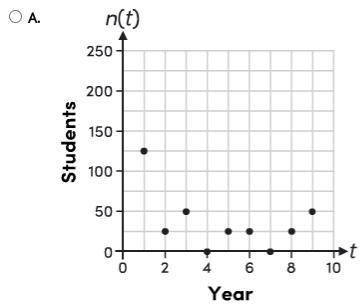
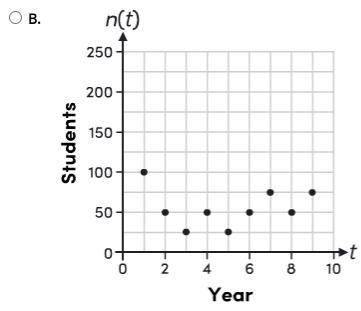
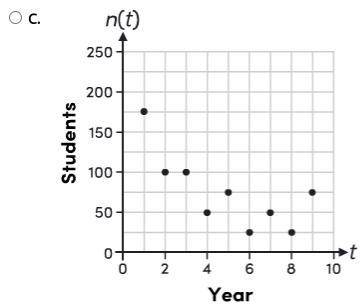
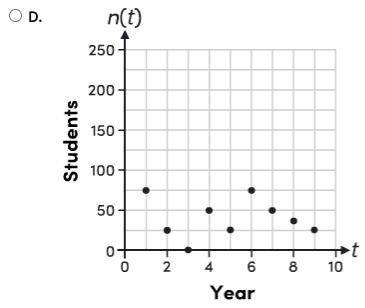
A teacher keeps track of the number of students that participate at least three times in an optional study session each year. He models the attendance over the last nine years with this function. n(t) = 3.53t^2 - 33.04t + 117.56 Which graph would most likely be associated with the given model?

Answers: 3


Another question on Mathematics
Mathematics, 21.06.2019 17:40
Which number produces a rationale number when multiplied by 1/5
Answers: 1
Mathematics, 21.06.2019 18:00
Suppose sat writing scores are normally distributed with a mean of 497 and a standard deviation of 109. a university plans to award scholarships to students whose scores are in the top 2%. what is the minimum score required for the scholarship? round your answer to the nearest whole number, if necessary.
Answers: 2
Mathematics, 21.06.2019 23:00
What is the location of point g, which partitions the directed line segment from d to f into a 5: 4 ratio? –1 0 2 3
Answers: 1
You know the right answer?
A teacher keeps track of the number of students that participate at least three times in an optional...
Questions

Biology, 05.02.2021 21:10

Health, 05.02.2021 21:10

Mathematics, 05.02.2021 21:10

Geography, 05.02.2021 21:10

History, 05.02.2021 21:10
Mathematics, 05.02.2021 21:10
Mathematics, 05.02.2021 21:10
Mathematics, 05.02.2021 21:10
Biology, 05.02.2021 21:10
English, 05.02.2021 21:10
Mathematics, 05.02.2021 21:10
History, 05.02.2021 21:10


