
Mathematics, 16.11.2020 04:40 lyss12326
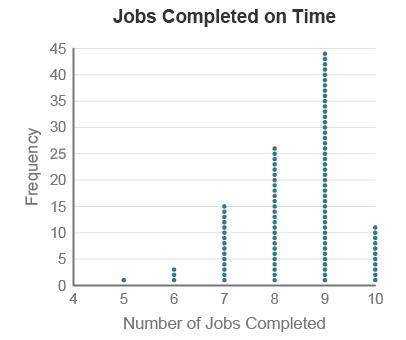
A contractor claims that she finishes a job on time 90% of the time. Last month, she only completed 7 out of her 10 jobs on time. To see if this is surprisingly low, a simulation was conducted 100 times under the assumption that she really does complete 90% of her jobs on time.
The dotplot contains 100 trials of this simulation.
A dotplot titled jobs completed on time has number of jobs completed on the x-axis, and frequency on the y-axis. 5, 1; 6, 3; 7, 15; 8, 26; 9, 45; 10, 11.
Based on this dotplot and the sample of last month’s on-time completions, which conclusion can be drawn?
The contractor’s true, on-time completion rate is only 50%.
It is most likely that the contractor will complete about 9 out of 10 jobs.
If we used a larger sample size of 40 jobs, the simulated dotplot would be different; therefore, we cannot draw a conclusion.
The dotplot does not provide convincing evidence that her true, on-time completion rate is less than 90% because 7 or fewer on-time completions happened 19% of the time in the simulation.

Answers: 1


Another question on Mathematics
Mathematics, 20.06.2019 18:04
Find equation of line with slope equals 8 and passing through (6,53)
Answers: 3
Mathematics, 21.06.2019 20:00
How to find the exponential function y=ca^x, with points (1,2) and (2,1)
Answers: 2
Mathematics, 21.06.2019 21:30
50 plz, given the system of equations, match the following items. x + 3 y = 5 x - 3 y = -1 a) x-determinant b) y-determinant c) system determinant match the following to the pictures below.
Answers: 2
You know the right answer?
A contractor claims that she finishes a job on time 90% of the time. Last month, she only completed...
Questions


Spanish, 20.10.2020 18:01


Social Studies, 20.10.2020 18:01

Mathematics, 20.10.2020 18:01
Mathematics, 20.10.2020 18:01

Physics, 20.10.2020 18:01
Mathematics, 20.10.2020 18:01

Business, 20.10.2020 18:01
Mathematics, 20.10.2020 18:01
Chemistry, 20.10.2020 18:01
Mathematics, 20.10.2020 18:01
English, 20.10.2020 18:01


