HURRYY
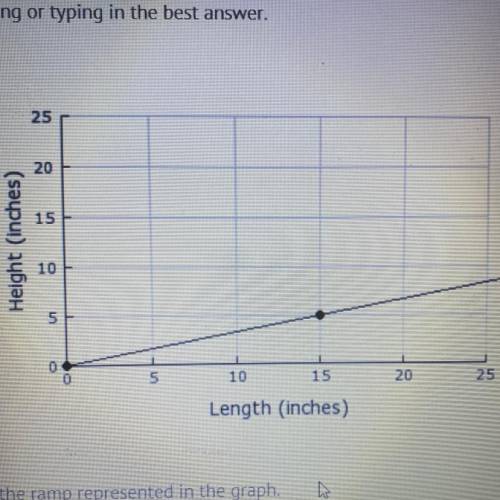
Find the rate of change for the ramp represented in the graph
...

Mathematics, 16.11.2020 20:40 emcarrell
HURRYY
Find the rate of change for the ramp represented in the graph

Answers: 2


Another question on Mathematics
Mathematics, 21.06.2019 18:30
The table shows the relationship between the number of cups of cereal and the number of cups of raisins in a cereal bar recipe: number of cups of cereal number of cups of raisins 8 2 12 3 16 4 molly plotted an equivalent ratio as shown on the grid below: a graph is shown. the title of the graph is cereal bars. the horizontal axis label is cereal in cups. the x-axis values are 0, 20, 40, 60, 80,100. the vertical axis label is raisins in cups. the y-axis values are 0, 10, 20, 30, 40, 50. a point is plotted on the ordered pair 40,20. which of these explains why the point molly plotted is incorrect? (a) if the number of cups of cereal is 40, then the number of cups of raisins will be10. (b)if the number of cups of raisins is 40, then the number of cups of cereal will be10. (c) if the number of cups of cereal is 40, then the number of cups of raisins will be 80. (d) if the number of cups of raisins is 40, then the number of cups of cereal will be 80.
Answers: 1
Mathematics, 22.06.2019 00:30
What is the slope of any line parallel to the line 8x+9y=3 in the standard (x,y) coordinate plane?
Answers: 1
Mathematics, 22.06.2019 04:10
You are in charge of the customer service phone line with many employees. at the end of each phone callthe customers are asked to rate their service from 1 to 5 stars, with 5 being the best. you find the averagerating for 20 randomly selected employees and decide you want to improve the ratings so you require thoseemployees to go through a new training program. you then wait a week and find the new average rating foreach employee. the average change is an increase in 1.3 stars with a standard devation of .9 stars.(a) is this data paired or not paired? (b) what are the null and alternative hypothesis being tested? (c) what is the t-statistic you would use? write the general formula and the final calculation.(d) sketch a t-distribution, label your t-statistic and the probability you would be interested in:
Answers: 2
You know the right answer?
Questions
Mathematics, 14.01.2021 15:30

Chemistry, 14.01.2021 15:30
Mathematics, 14.01.2021 15:30
Mathematics, 14.01.2021 15:30

Social Studies, 14.01.2021 15:30

Biology, 14.01.2021 15:30
Mathematics, 14.01.2021 15:30


Spanish, 14.01.2021 15:30
English, 14.01.2021 15:30
Mathematics, 14.01.2021 15:30

English, 14.01.2021 15:30
Mathematics, 14.01.2021 15:30
Biology, 14.01.2021 15:30

History, 14.01.2021 15:30
English, 14.01.2021 15:30


