Given the graph of the function, answer the following:
1. What is the domain?
2. What is the...

Mathematics, 17.11.2020 05:20 2016gbryant
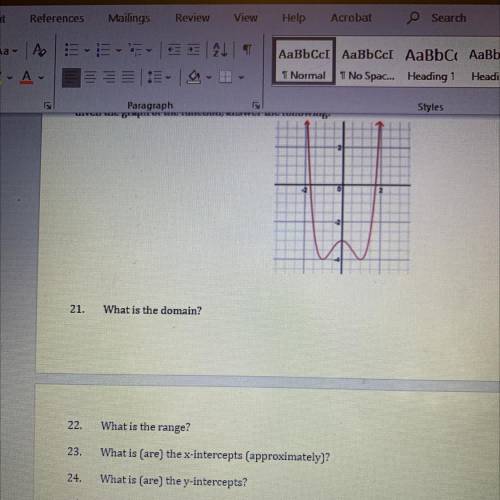
Given the graph of the function, answer the following:
1. What is the domain?
2. What is the range?
3. What is (are) the x-intercepts (approximately)?
4. What is (are) the y intercepts?
5. On which interval(s), if any, is the function increasing?
6. What is f(2)?
7. What is f(1)?
8. What point is the relative max?
9. For which x-value(s) is f(x)=-2
For the domain I got (- ∞, ∞) and range [-4, ∞). I’m not sure if those are right but I’m confused on the other questions and need help. Thanks!

Answers: 2


Another question on Mathematics
Mathematics, 21.06.2019 18:50
The volume of a cone is 37x3 cubic units and its height is x units. which expression represents the radius of the cone's base, in units? 1 s o 3x o 6x obx 93x2
Answers: 1
Mathematics, 21.06.2019 23:00
Acaterer knows he will need 60, 50, 80, 40 and 50 dinner napkins on five successive evenings. he can purchase new napkins initially at 25 cents each, after which he can have dirty napkins laundered by a fast one-day laundry service (i.e., dirty napkins given at the end of the day will be ready for use the following day) at 15 cents each, or by a slow two-day service at 8 cents each or both. the caterer wants to know how many napkins he should purchase initially and how many dirty napkins should be laundered by fast and slow service on each of the days in order to minimize his total costs. formulate the caterer’s problem as a linear program as follows (you must state any assumptions you make): a. define all variables clearly. how many are there? b. write out the constraints that must be satisfied, briefly explaining each. (do not simplify.) write out the objective function to be minimized. (do not simplify.)
Answers: 1
Mathematics, 22.06.2019 01:30
Novak gives 9 packs of paper to a group of 5 students. if the group shares the paper equally how many packs of paper does each student get. write the a answer as a mixed number
Answers: 1
Mathematics, 22.06.2019 01:30
The box plots show the distributions of the numbers of words per line in an essay printed in two different fonts.which measure of center would be best to compare the data sets? the median is the best measure because both distributions are left-skewed.the mean is the best measure because both distributions are left-skewed.the median is the best measure because both distributions are symmetric.the mean is the best measure because both distributions are symmetric
Answers: 1
You know the right answer?
Questions

Spanish, 03.09.2021 19:20


Advanced Placement (AP), 03.09.2021 19:20
Mathematics, 03.09.2021 19:20

Chemistry, 03.09.2021 19:20
Mathematics, 03.09.2021 19:20

Mathematics, 03.09.2021 19:20
Mathematics, 03.09.2021 19:20


