
Mathematics, 18.11.2020 01:20 yannie16
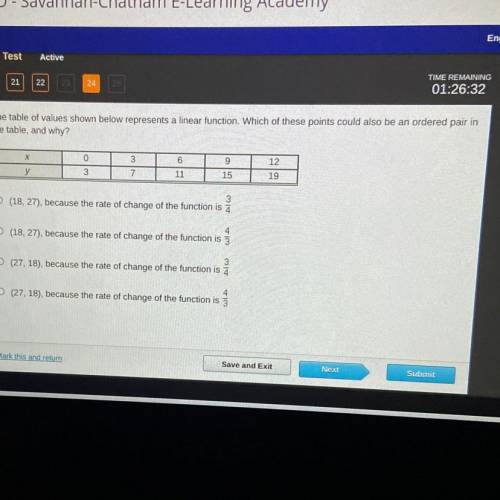
The table of values shown below represents a linear function. Which of these points could also be an ordered pair in
the table, and why?
9
12
wo
0
3
3
7
BIO
9
15
у
19
3
O (18, 27), because the rate of change of the function is a
O (18, 27), because the rate of change of the function is 3
들
3
O (27, 18), because the rate of change of the function is a
(27. 18), because the rate of change of the function is 3
3 을

Answers: 2


Another question on Mathematics
Mathematics, 21.06.2019 12:50
Plz, ! the box plot below shows the total amount of time, in minutes, the students of a class surf the internet every day: a box plot is shown.part a: list two pieces of information that are provided by the graph and one piece of information that is not provided by the graph. (4 points) part b: calculate the interquartile range of the data, and explain in a sentence or two what it represents. (4 points) part c: explain what affect, if any, there will be if an outlier is present. (2 points)
Answers: 3
Mathematics, 21.06.2019 15:30
Find the slope of the line below . enter your answer as a fraction or decimal. use a slash mark ( / ) as the fraction bar if necessary
Answers: 1
Mathematics, 21.06.2019 20:30
Create a question with this scenario you could ask that could be answered only by graphing or using logarithm. david estimated he had about 20 fish in his pond. a year later, there were about 1.5 times as many fish. the year after that, the number of fish increased by a factor of 1.5 again. the number of fish is modeled by f(x)=20(1.5)^x.
Answers: 1
You know the right answer?
The table of values shown below represents a linear function. Which of these points could also be an...
Questions

English, 13.09.2021 19:20


Biology, 13.09.2021 19:20

Advanced Placement (AP), 13.09.2021 19:20
English, 13.09.2021 19:20
English, 13.09.2021 19:20
Mathematics, 13.09.2021 19:20
Health, 13.09.2021 19:20
Mathematics, 13.09.2021 19:20
Mathematics, 13.09.2021 19:20
Mathematics, 13.09.2021 19:20


